Description
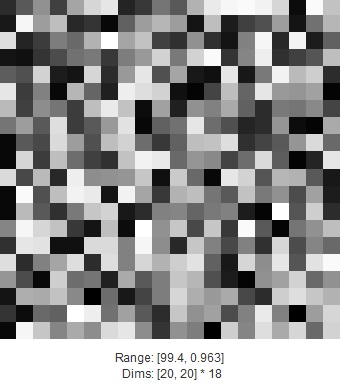
Display a MatLab MATRIX as a grayscale image in the current figure, inside the current axes. If MATRIX is complex, the real and imaginary parts are shown side-by-side, with the same grayscale mapping.
If MATRIX is a string, it should be the name of a variable bound to a MATRIX in the base (global) environment. This matrix is displayed as an image, with the title set to the string.
RANGE (optional) is a 2-vector specifying the values that map to black and white, respectively. Passing a value of ‘auto’ (default) sets RANGE=[min,max] (as in MatLab’s imagesc). ‘auto2’ sets RANGE=[mean-2*stdev, mean+2*stdev]. ‘auto3’ sets RANGE=[p1-(p2-p1)/8, p2+(p2-p1)/8], where p1 is the 10th percentile value of the sorted MATRIX samples, and p2 is the 90th percentile value.
ZOOM specifies the number of matrix samples per screen pixel. It will be rounded to an integer, or 1 divided by an integer. A value of ‘same’ or ‘auto’ (default) causes the zoom value to be chosen automatically to fit the image into the current axes. A value of ‘full’ fills the axis region (leaving no room for labels).
If LABEL (optional, default = 1, unless zoom=’full’) is non-zero, the range of values that are mapped into the gray colormap and the dimensions (size) of the matrix and zoom factor are printed below the image. If label is a string, it is used as a title.
NSHADES (optional) specifies the number of gray shades, and defaults to the size of the current colormap.
Molecular Pattern Discovery based on Penalized Matrix Decomposition
Tumor Clustering Using Non-negative Matrix Factorization with Gene Selection

Reviews
There are no reviews yet.