Rapid Volumetric OCT Image Acquisition
transformations, such as wavelet and discrete cosine transforms. The popular JPEG-2000 image compression algorithm implements a version of the decimated wavelet transform with great success. During the compression stage, many of the transform coefficients are
discarded, and only the ones that capture most of the signals energy are retained. Compressive Sampling (CS) addresses the issues of reconstructing the signal accurately when only a few of the significant coefficients in a transform domain have been retained ( to
name a few). In this report, we employ these results to develop a method that can recover the full 3D OCT image volume given only a sub-sampled volume. The theoretical justification for the choice of subsampling required for high fidelity CS recovery comes from the
work of Candes and Romberg which suggests sampling the object at randomly spaced vertical and horizontal lines skipping a large portion of the image during acquisition. This scan pattern, schematically illustrated in Fig. 2 is compatible with typical implementations of Volumetric Optical Coherence Tomography (OCT) scanning hardware, first acquiring a series of B-scans with irregular spacing in the horizontal orientation, followed immediately by an acquisition over the same area with irregularly spaced vertical B-scans. Following this randomly subsampled acquisition we show how CS-based reconstruction using an Iterative Soft Thresholding (IST) technique can recover the full 3D image data with high fidelity transformations, such as wavelet and discrete cosine transforms. The popular JPEG-2000 image compression algorithm implements a version of the decimated wavelet transform with great success. During the compression stage, many of the transform coefficients are discarded, and only the ones that capture most of the signals energy are retained. Compressive Sampling (CS) addresses the issues of reconstructing the signal accurately when only a few of the significant coefficients in a transform domain have been retained ( to name a few). In this report, we employ these results to develop a method that can recover the full 3D OCT image volume given only a sub-sampled volume. The theoretical justification for the choice of subsampling required for high fidelity CS recovery comes from the work of Candes and Romberg which suggests sampling the object at randomly spaced vertical and horizontal lines skipping a large portion of the image during acquisition. This scan pattern, schematically illustrated in Fig. 2, is compatible with typical implementations of OCT scanning hardware, first acquiring a series of B-scans with irregular spacing in the horizontal orientation, followed immediately by an acquisition over the same area
with irregularly spaced vertical B-scans. Following this randomly subsampled acquisition we show how CS-based reconstruction using an Iterative Soft Thresholding (IST) technique can recover the full 3D image data with high fidelity
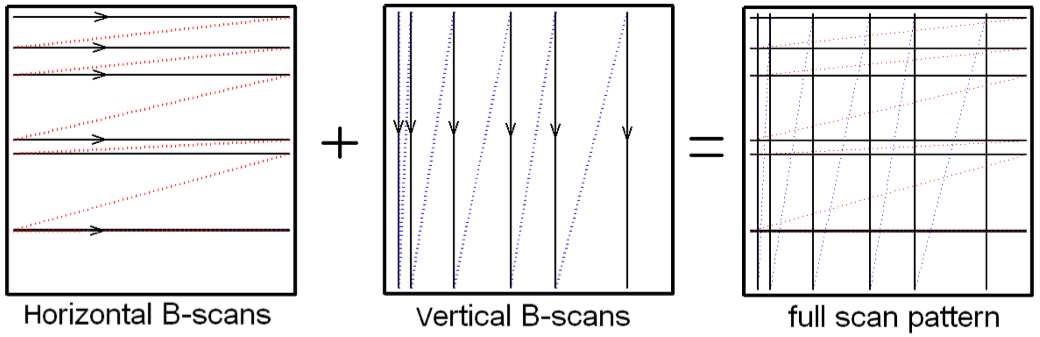
Figure 1: Proposed scan pattern consisting of randomly spaced horizontal B-scans and randomly spaced vertical B-scans. The doted lines represent the fly-back trajectory of the galvonometer mirrors
Validation
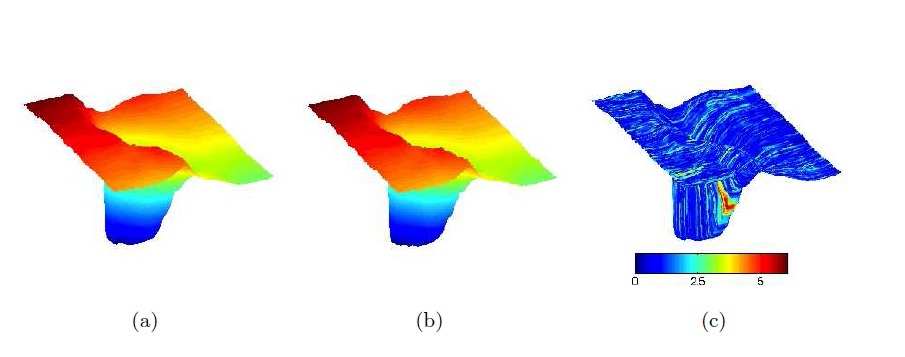
We(Evgeniy Lebed) performed experiments to quantify how the degradation in recovered images affected the measurement of anatomically meaningful parameters such as the optic nerve cup shape. Morphometric analysis of changes in the shape of the optic nerve head have been proposed as a possible early diagnostic indicator of glaucomatous change. This was done by manually
segmenting the clinically relevant Inner Limiting Membrane (ILM) surface for the reconstructed image volume for each of the five levels of degradation using an internal protocol developed in collaboration with clinical author (PJM). These segmentations were performed
on each B-scan slice of every volume. The extracted ILM surface from one of the segmentations of the original 3D image is shown in Fig.3(a) where the color map represents the vertical height (to better present the 3D nature of the cup). The ILM surface extracted from the recovered volume with 53% missing data, shown in Fig. 3(b), closely resembles that of the original ILM. The recovered image will be deemed to have passed the fidelity test if the location of the ILM surface segmented from the recovered image falls within the variability of the surface segmentations performed multiple times on the original image volume by the same rater. To quantify the segmentation variability due to the manual rater, the ILM in the original 3D image was segmented thrice, each time by the same rater but without consulting
the previous segmentations. Using these, an average ILM surface was created representing baseline or ground truth. The standard deviation of each points position as observed in the three manual segmentations of the original volume was calculated. The surface shown in Fig.3(c) is the average ILM where the colormap represents the variance in position in the three manual segmentations of the original image volume.For each point on the ILM surface segmented from the reconstructed data, the relative position to the average ILM surface (the baseline) was found. This process generates the so-called Topographical Change Analysis (TCA) map, representing the variability in position of the ILM surface from a known baseline/ground truth. Points on recovered ILM surface lying more than one standard deviation away from the average baseline surface are shown as the TCA overlaid on top of the summed voxels projection image of the original volume in Fig.3 One can see that the quality of the summed voxel projection images begins to deteriorate at the 61% missing data volume, but is still acceptable even at 75% missing data. The red and green colors represent posterior and anterior change in position, respectively. For the volume that was recovered from 23% missing data, nowhere did the segmentations fall outside the one standard deviation regions. For the other cases with more missing data, most points in the image were reconstructed faithfully so that the errors in position exceeded one standard deviation in only a few locations. These were typically in slices with missing data that were located along the steeply sloping part of the ILM surface. Given that only a few locations in recovered surfaces deviated by more than one standard deviation for each of the five cases tested (as an example, < 8% points on the recovered ILM surface were farther than one standard deviation in the case of 75% missing data), clinical measurements such as cup volume and area (see Table 2.1) did not significantly differ from the measurements made on the original volume. The cup volume was measured as the space enclosed by a reference plane near the top of the volume and the manual segmentation of the ILM in the cup. The surface area of the ILM closed by the reference plane and the cup was also calculated. Changes in surface area and volume of the nerve cup from recovered images were assessed to be clinically negligible by the clinical collaborator (Dr. Paul J.
Mackenzie, MD).

Figure 3: (a) Extracted internal limiting membrane (ILM) of the optic nerve head from the original image. Color map represents the height function. (b) Extracted ILM from the recovered volume with 53% missing data. (c) Standard deviation of distance of the three segmentations of the original image volume, computed to measure the natural variability in segmentation of ILM from original image. Reagins of relatively high variability appear to be well-localized.
Table 2