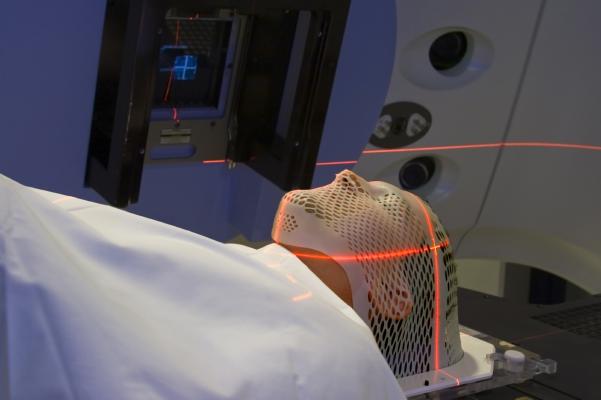
Introduction
Most head and neck cancers (HNC) begin in squamous cells that line the moist surface inside the head and neck (HN). According to National Cancer Institute, HNC can begin in multiple sites and from different cells within a particular site . This type of cancer accounts for approximately 3 percent of all cancers in US. HNC occur twice as often in men than in women. In 2015, an estimated 45,780 new cases of cancer are expected. Different treatment approaches include surgery and radiation therapy along with chemotherapy for advanced diseases. In advanced diseases combinations of treatment methods available are often used . According to the cancer fact sheet, 31% of cases are diagnosed at early local stages. For these early detected diseases, the 5 year survival rate can be up to 83% . Intensity Modulated Radiation Therapy (IMRT) is one of the preferred methods of external beam therapy which defines specific organs at risk (OAR) and the target volume to minimize dose to healthy tissue, while achieving adequate coverage of the target . Due to the intricate juxtaposition between the tumor and OARs, HNC is often considered to be one of the most challenging disease sites for IMRT planning, which motivated our current study to focus on this problem. Parotid salivary output is a particularly concerning side effect for HNC and is related to the quality of life after treatment. Common negative side effects of IMRT include xerostoma, dysphagia, and aspiration, which are all connected to the radiotoxicity to organs within the treatment area.For HNC IMRT, up to 9 beams are used and the orientation can differ from patient to patient.
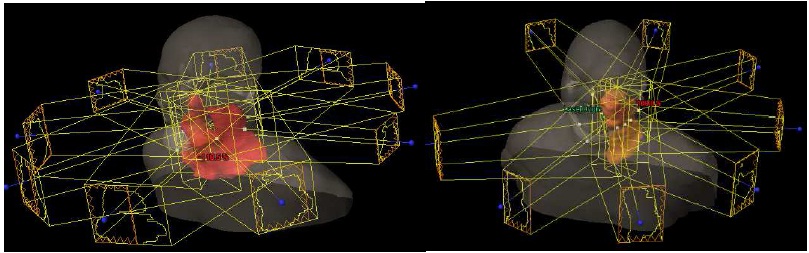
Figure 1: Examples of different beam orientation. On the left is the standard 9
beam. On the right only 8 beams are used for a unilateral case.
Each angle will have its own beams eye view of the target volume and the organs at risk around the target volume. With this information, a user can define constraints such as the volume, dose, and a priority value for each organ. The optimization process will lower the dose delivered to the OAR while increasing dose coverage of the target volume. The target volume will include the gross tumor volume and add margins that take into account possible microscopic spread of tumor cells, uncertainty in the beam delivery, and movement of the patient. For this study, a total of six organs at risk are examined: left parotid, right parotid, larynx, oral cavity, brainstem, and spinal cord. At Duke University Medical Center, the delineation of the cord includes a 5 mm margin. Therefore, this study will examine cord +5 mm instead of just cord. The standard recommended starting point limits of Duke University Medical Center has the following constraints:

Table 1: Example of constraints provided by Duke University
Medical Center when optimizing head and neck cancer.
When considering the parotids, it is more important to compare whether or not the organ is close to or far from the target volume. Parotid that is closer to the planning target volume (PTV) will be categorized as ipsilateral parotid and would likely receive more dose than the contralateral parotid. Therefore, ipsilateral parotids hold more clinical importance compared to the contralateral parotids.
Figure 2: An example of planning target volume and positions of contralateral
and ipsilateral parotid glands.
Once the optimization is achieved, the clinic can analyze the results by comparing dose volume histograms. The IMRT uses constraints as defined by the planner to create an optimal treatment plan on a patient to patient basis. This leads to increased cost due to the increased amount of time that physician and other staff need to spend . Because the treatment planning depends on the treatment planner, there is variability in quality of beam produced to treat the patient between different clinics and planners. Due to the large dependence on skill and experience of the planner, there are many efforts to automate or semi-automate the process of IMRT treatment planning in different sites such as pancreas, prostate, and HNC.
Knowledge Based Radiation Therapy and Optimization
In previous studies, we generated a database of 105 patients from 2009 to 2012 that had already been treated for head and neck cancer [23]. Each case in the database has a primary plan and one or two boost plans which are patient specific. Most cases will have will have 9 beam angles for the patient which surround the patient’s neck starting at 180 degrees and in increments of 40 degrees. Therefore, the most common 9 beam angles are 180, 140, 100, 60, 20, 340, 300, 260, and 220. In some cases, the treatment planner may use only 8 or even 7 beams in order to avoid beams that would unnecessarily traverse more healthy tissue than necessary. These plans are often unilateral plans. As shown below, HNC cases can be categorized into bilateral, unilateral right, and unilateral left. Simply, patients whose target volume is only on one side are considered unilateral and otherwise would be considered bilateral. KBRT algorithms handle cases within each category separately.
Figure 3: example PA beam’s eye view images of unilateral and bilateral cases.
From left to right, right unilateral, left unilateral and a bilateral case.
For HNC, 6 MV beams at maximum dose rate of 300 MU/s are used. For this study the OARs that will be examined are left parotid, right parotid, larynx, oral cavity, brainstem, and cord. As mentioned before, cord is often added extra margins, therefore, cord + 5 mm will be examined. The cases in the database were manually optimized by the staff at Duke University Medical Center to meet the constraints set by the oncologists. Depending on the patient, the constraints would be tightened or loosened. In general, the limits set by physicians differ from the values shown in table 1. Forexample, left and right parotids constraints were set at < 25 Gy, larynx constraints were set at < 30 Gy, oral cavity constraints were set at < 35Gy, brainstem constraints were set at < 25 Gy, and cord +5 mm constraints were set at < 45 Gy. The parotids, larynx, and oral cavity were characterized by the median dose, while the brainstem and cord +5mm were characterized by the maximum dose.
Database Re-optimization
To assess the impact of database quality on the KBRT algorithm, each case in the database was re-optimized. Because the re-optimization was done by a trainee, care was taken to ensure that the re-optimized dose volume histogram (DVH) should improve without any OAR showing increased dose. When re-optimized plans resulted in an increase in dose of one OAR while there was a decrease in another OAR, those plans were rejected and the process was repeated from start with a looser constraint. .an update in Eclipse calculation and optimization software resulted in unexpected changes in the DVH for certain cases. These differences were confirmed by rerunning the clinically approved plan without any changes. For cases that showed these changes, re-optimization was based on the updated version of the clinically approved DVH, as the original DVH could no longer be reproduced. For certain cases showing greater than 5% change in the PTV maximum dose (corresponding to unacceptable hot spots), another contour was made for the hot spots to bring down the dose. The re-optimization was done in two possible ways. Priorities were slowly increased to see if the DVH would change over time without having negative effects. Similarly, dose volume constraints were slowly tightened also as long as there were no negative effects to the PTV or other OARs. The study aimed to keep the PTV as close as possible to the clinically approved plans. Therefore, any optimization that resulted in noticeable in homogeneity or a change of maximum PTVdose greater than 5% was deemed unacceptable. In order to reduce the dose to OARs, the volume, dose, and priority values were changed. These values affect the optimization process, which uses an objective function that will consider the beam fluence to determine which volume to avoid or irradiate by assessing the size of the OAR volumes, dose, and priority of the OAR to be saved. These in turn affect the movement of the multi-leaf collimators, which shape the beams at each angle. The original patient beam information and the re-optimized patient beam information were exported and were used to obtain new constraints.
Matching Case Selection
For this study, to simulate the process of creating a de novo plan for a new clinical case, a “query” case was selected from the database and then matched against the other cases. Of the 105 cases present in the database, two cases were excluded due to abnormal PTV. In order to find the matching case, the anatomical information is exported from the clinical Eclipse treatment planning system (Varian Medical Systems, Palo Alto CA) as DICOM file and then imported into the Computational Environment for Radiotherapy Research (CERR) software package via MATLAB (Mathworks, Natick, MA) to obtain 39 dimensional images. With the 3 dimensional images, a mask is created to create a binary image of OAR and the PTV in 2D for each beam angle. A mask of all the OAR and PTV can be made to show overlaps and is then used to compare the query versus the other patients in the database. The query case will replicate the beam angle set up of the matching case, so using only two different BEV to calculate the similarities is sufficient.To begin the matching process, squared error (SE) is first used. The query case is set as target image and matching case as the moving image. Then the match image is translated along the gradient descent of least squared error to align the two BEV images.The choice to use SE was due to its faster computational time .