Clinical Dose Reduction Strategies
Some clinically used strategies for dose optimization will be briefly discussed in this subsection. It is notable that for dose optimization, the exam must be performed using doses that are As Low As Reasonably Achievable (ALARA), consistent with the diagnostic task at hand A better understanding of possible strategies can be obtained by examining the following CT dose parameters:
1. Tube voltage (kV) is the potential difference between cathode and anode of the X-ray tube. The radiation dose is proportional to square of tube voltage.
2. Current-rotation time product (mAs) represents the photon fluence, which is the number of photons that enter an imaginary sphere, with a cross-sectional area of 1 m2, and is directly proportional to the radiation dose.
3. Pitch is the ratio of table feed per gantry rotation to nominal width of beam collimation and it is inversely proportional to radiation dose. It is notable that an increase in the pitch decreases the duration of radiation exposure
. A fundamental part of CT dose optimization is based on the used of body size-adapted CT protocols. Minimal required radiation dose would be variable for different patients depending on body size and habitus. Hence, the optimal tube voltage and current should be determined for the adapted radiation dose. There have been different studies on finding the body size-adapted CTprotocols for children and adults. In these studies, body mass index or body weight has been applied to the adaptive protocols. However, researchers have found that cross-sectional dimensions can be better used to find the body size-adapted CT protocols. It is notable that parameters other than body weight or body mass index have not been commonly used for CT protocols. The reason is the difficulty in clinical implementation of them. Another strategy for dose reduction is tube current modulation. The basic idea is to adapt the tube current to attenuation of the body region. This means to increase the current for a more
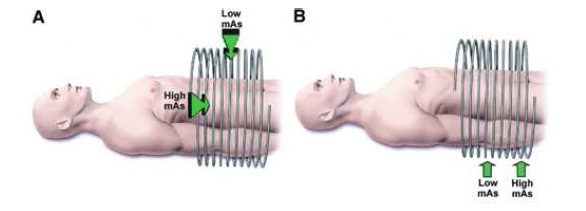
Figure 2: (A) Angular modulation in which the x-ray tube current is lowered as the X-rays are aimed in the anteroposterior directions, and increased when the X-rays are aimed in thelateral-medial directions, when there will be more X-ray attenuation. (B) Z-axis modulation in which, for example, fewer X-rays are required in the abdominal region superior to the pelvic bones compared with the pelvic region. Reproduced, with permission
attenuating area and decrease it for a less attenuating area. The overall goal is to reduce dose while maintaining the image quality. The tube current may be adjusted in the x-y plane, the z-axis, or a combination of both. Figure2 shows principles of tube current modulation .In addition, a graphic illustration of tube current modulation is shown in figure3 With other scanning parameters held constant, a reduction in tube current decreases radiation exposure but increases image noise or mottle, a principle determinant of image quality. The use of tube current modulation has helped in CT dose reduction of up to 15-50% in children and adults.In addition to the previous strategies, the importance of optimal tube voltage has been emphasized in recent studies . Figure 3 shows the linear attenuation coefficients of iodine, cortical bone and water as a function of X-ray energy. The graph shows that the attenuation coefficient is different for different materials and depends on the X-ray energy. This affects image contrast, meaning that at lower tube voltages the contrast increases. However, lower tube voltages have some disadvantages including higher noise in the image. At higher tube voltages the photon penetration will be increased which results in having less severe artifacts from metallic objects or thick bones such as the skull base. Hence, there is a trade off between image noise and contrast enhancement. Therefore, the optimal tube voltage should be determined for patient size and each type of CT examination to achieve an optimal trade off between contrast and noise.

Figure2: Graph of tube current (mA) superimposed on a CT projection radiograph showing the variation in tube current as a function of time (and, hence, table position along the z-axis) at spiral CT in a 6-year-old child. An adult scanning protocol and an AEC system (CareDose 4D; Siemens Medical Solutions) were used with a reference effective tube current-time product of 165 mAs. The mean effective tube current-time product for actual scanning was 38 mAs (effective tube current-time product-tube current-time product/pitch). Reproduced, with permission
Figure 3: The linear attenuation coefficients of iodine, cortical bone and water as a function
of X-ray energy.The yellow arrows show the contrast between water and iodine in 80kV and
140kV, which are more distinct in 80kV. Reproduced, with permission