Video Conferencing Quality under Network Impairments
Wireless networks are much more volatile than wireline networks. The unique challenge for mobile video call is to maintain stable realtime video streaming quality in face of various network impairments, such as random and bursty packet loss, long delay and delay jitter, and time-varying cross-traffic. In this section, we analyze the impact of network impairments on the delivered video quality in the three systems.
Video Conferencing Quality
As with any video streaming service, a user in a video conferencing is sensitive to the perceptual quality of the delivered video, which is determined by various encoding parameters, such as video frame size, frame rate, and quantization levels. The delivered user perceptual video quality increases as the delivered video rate increases. Since video conferencing is to facilitate realtime interaction, users are also
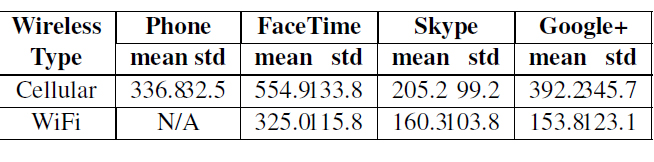
Table 6 : Voice Delay (millisec) During A Regular Phone Call Or Video Calls in 5 Minutes
highly sensitive to end-to-end video delays, video playback continuity and smoothness. To achieve good overall video conferencing quality, a user’s video data has to be streamed consistently at high rate and low delay, with low rate and delay variations.Here we first compare the voice delay of the three systems over WiFi or cellular with the voice delay of the integrated voice call service from the service providers. We use the voice delay measurement technique developed in. As reported in Table 6, the integrated voice service is more stable than the three systems. It is not surprising, given that wireless carriers reserve bandwidth for their voice services.We are more interested in the video quality of the three systems over either WiFi (Figure 2.7) or Cellular (Figure 2.9), with strong or weak signal. For each system in each network condition, we plot the total video traffic rate and the one-way video delay collected using the technique presented in Section 2.2.2. The rate curves visually illustrate the video quality variations over time. The measured video delays not only quantify how much delay each system introduces to realtime user interaction, but also enable us to assess the video playback continuity and smoothness. Specifically, spikes in a delay curve are resulted from video freezes. In the example of Figure 2.2, whenever the received video freezes, the received stopwatch freezes. Meanwhile, the stopwatch in the source video continues to advance. Consequently, the reading gap of the two stopwatches ramps up quickly until the freeze stops and new video is rendered in the received video window. It is also interesting to notice how different systems recover from video freezes. For FaceTime and Google+, after each delay spike, video delay jumps back to the normal level; but in Skype, video delay gradually goes back to the normal level. We believe this is is due to different policies to handle delayed video frames. In FaceTime
and Google+, whenever there is a video freeze, they choose not to display subsequent frames with long delays. Video playback resumes only after a video frame is received with acceptable delay. That is when the measured video delay jumps back to the normal level. Skype chooses to display received frames with long delays. To catch up with the realtime conferencing, Skype also plays the delayed frames in a fast-forward fashion. This explains the gradual video delay decrease after each spike. The major problem of Google+ Hangout is video freeze, with duration lasting 3 to 5 seconds. Skype also experiences video freeze. The difference is the duration of freeze is shorter – most time are within 2 seconds. But besides freezes, Skype also suffers nonuniform speed playback. FaceTime has the best performance in terms of video smoothness among three applications. But still, freeze happens from time to time, lasting around 0:5 to 1 second. Same video delay measurement was performed on a moving subway. As showed in Figure 2.10, we are surprised by the finding that the round-trip video delay can go as high as 14 seconds. For Skype, after a long delay,it takes so long to recover video delay to normal. Video call user had to suffer from delayed video playback as long as 100 seconds. Instead, FaceTime and Google+ choose to give up those delayed video frames and quickly go back to normal playback after video freezing. Given the observed video quality, we want to find out how various network impairments contribute to video conferencing quality degradation.
Impact of Packet Loss
Naturally, we first check whether video freezes are triggered by packet losses. We identify packet losses by matching packet traces collected at the sender side and the receiver side. For FaceTime and Skype, packets can be matched by their payload even if they go through a relay server. Google+ relay servers change packet payload, packets

Table 2.7: Number of Packet Losses Within 2 Seconds Before Video Freezes
are instead matched by their RTP headers. For FaceTime and Skype, packet losses identified this way are indeed the end-to-end packet losses. Google+ employs selective persistent retransmission, the identified packet losses are the end-to-end packet losses not recovered by Google+’s retransmission algorithm, which affect the delivered video quality. For each video freeze in Figure 2.7 and 2.9 which lasts for at least 1 second, we count how many packets were lost in the two-second period immediately before the freeze. We then calculate the average loss number over all freezes, and compare it with the average packet loss number in all two-second periods over the entire experiment. Table 2.7 shows that in most cases, the average packet loss number before a video freeze is significantly higher than the overall average, suggesting a strong correlation between video freezes and packet losses. Meanwhile, it should also be noticed that in some cases ( e.g. Google+ with strong wifi signal in Table 2.7), the correlation is weak. We conjecture that in those cases video freezes are mainly due to long packet delays and delay jitters.
FEC is not efficient enough to recover from bursty losses in wireless environment
Skype adopts FEC to recover from packet losses. However, it is well-known that FEC is vulnerable to bursty packet losses. Generally, for a FEC code, such Reed- Solomon code, if one FEC block of n packets contains k original data packets, FEC protection fails whenever the number of losses experienced by the n packets is greater than n-k/k. One solution is to increase FEC block length n while keeping a low FEC overhead ratio n-k/k . This requires each FEC block contains video packets from multiple
Table 2.8: Burst Loss Length
video frames, especially when the video encoding rate is low. In video conferencing, video frames are generated in realtime, long FEC blocks lead to long FEC encoding and decoding delays. As a result, FEC blocks in video conferencing have to be short. Our previous work has demonstrated that Skype’s FEC cannot recover from burst losses injected by a network emulator. Now we investigate the impact of bursty losses in real wireless network environment. Given a stream of packets sent out by the source, our packet-matching process identifies whether a packet is received or not. In Table 2.8, we plot the distribution of loss burst length of five groups of 600-second video calls in both strong and weak signal. We can see that when the video call is over Cellular, packet loss with burst length larger or equal to 2 happened at least 10 times. As for WiFi, due to higher video throughput, we see more bursty losses. There are several loss bursts with length larger than 10. It is very hard for FEC to recover from those loss bursts. Figure 2.12 visually illustrates the correlation between loss bursts and video freeze for FaceTime under weak cellular signal.
Skype’s FEC scheme leads to “vicious circle”
There is another problem with Skype’s FEC scheme, which is more fatal to its video quality. As we discussed in Section 2.3.3 and 2.3.4, Skype aggressively increases its FEC ratio as packet loss rate goes up. Meanwhile, Skype doesn’t change its video rate and still tries to take all the available bandwidth. Whenever there is congestion, available bandwidth shrinks, and packets get lost, Skype still try to add more FEC redundant packets to recover from packet losses. Those FEC redundant packets add fuel to the fire and further increase packet losses. In Figure 2.13, we demonstrate this vicious circle by adding bandwidth constraint to the WiFi router. We start with bandwidth cap of 500 kbps. After the sending rate stabilizes in five minutes, we drop the available bandwidth by 100kbps. Then we plot the video rate, total sending rate, and one-way video delay in the same figure. Before the bandwidth drop, the Skype sending rate is either already higher than the available bandwidth (Figure 2.13c) or very close to it (Figure 2.13d). After the drop, immediately Skype senses a high loss ratio and keeps a high FEC redundant ratio (Figure 2.13c) or increases it (Figure 2.13d). This leads to large video delay oscillations. We did the same experiment with Google+ Hangout and FaceTime. Both of them keep their sending rates below the bandwidth cap and video delay is acceptable most of the time. In practice, the available network bandwidth is more dynamic than the constant cap. To test how different systems cope with changing bandwidth, we added both fixed bandwidth constraint (1 mbps) and background TCP connections (total number: 0,1 or3) to the WiFi router. Figure 2.14 shows a similar unstable video playback pattern on Skype. After a TCP competing flow was injected, Skype’s video was distorted so much that even the stopwatch reading in the received video window cannot be recognized by the OCR application. Video freeze can go as high as several seconds. Again, although the video quality of Google+ Hangout and FaceTime are also impacted by the TCP flows, things are much better controlled when compared with Skype.
Table 2.9: Average Packet Delay Within 2 Seconds Before Video Freeze
Impact of Packet Delay
Wireless networks can introduce long packet delays. In, a ping-style measurement show that in New York, NY, the average RTT of WiFi and Cellular is 111.9 and 282.0, respectively, and New York’s RTT performance is already on the upper-middle class among all 15 metro areas. We also measure the one-way packet delay between our video sender and receiver. Figure 2.15 shows that one-way delay variance could go as high as 400 ms. To cope with this, a buffer at video side must be set and a quite a lot of delay will be introduced. Given such a high packet delay, the performance of retransmission should be questioned. To verify that, we injected 20% packet loss rate and 200 ms packet latency in both direction to the WiFi router during a Google+ Hangout video call. Then for each packet, we calculate in how long time it can be transmit through that router. The result in Figure 2.16 shows that the packet delay introduced by retransmission can reach 2 seconds. we don’t know how important is that particular recovered packet, but we do know the extra delay will cause troubles to deliver a smooth video. Table 2.9 compares the average packet delay within two seconds immediately before a video freeze with the average delay over the whole experiments with weak WiFi/Cellular signal. It is noted that packet delay right before freezes are higher, especially in WiFi.To correlate user-perceived video delay with end-to-end packet delay, we calculate the correlation coefficients between the two at different time lags. Specifically, Let be the measured delay of a packet captured at the receiver side at its local clock time t ; be the stopwatch reading difference recognized from the receiver screenshot captured at its local clock time t. Using the collected packet delay and video delay traces, we can estimate the cross-correlation function between video delay and packet
delay as :
where ![]() and
and ![]() are the observed average video and packet delay in each experiment. Note, due to video playback buffering, decoding and rendering delays, the video displayed in the received video window at time t are decoded from packets received before t. So the maximum cross-correlation should be observed at some > 0. As plotted in Figure 2.17, the correlation peak near time shift 0 is not significant in strong WiFi networks, but is very obvious for weak WiFi, and Cellular, strong or weak. This is mainly because Cellular introduces longer packet delays than WiFi even with strong signals. High base correlation in Figure 2.17 (b),(c),(d) may due to high autocorrelation of packet delay, as in Figure 2.18.
are the observed average video and packet delay in each experiment. Note, due to video playback buffering, decoding and rendering delays, the video displayed in the received video window at time t are decoded from packets received before t. So the maximum cross-correlation should be observed at some > 0. As plotted in Figure 2.17, the correlation peak near time shift 0 is not significant in strong WiFi networks, but is very obvious for weak WiFi, and Cellular, strong or weak. This is mainly because Cellular introduces longer packet delays than WiFi even with strong signals. High base correlation in Figure 2.17 (b),(c),(d) may due to high autocorrelation of packet delay, as in Figure 2.18.
Figure 2.7: One-way Video Delay for FaceTime Skype and Google+ Hangout over WiFi
Figure 2.9: One-way Video Delay for FaceTime Skype and Google+ Hangout over Cellular
Figure 2.10: Round-Trip Video Delay for FaceTime Skype and Google+ Hangout On Moving Subway Skyline
Figure 2.11: Packet Delay for FaceTime Skype and Google+ Hangout On Moving Subway Skyline(average packet loss ratio are 2.2%, 2.1% and 2.9%, respectively.)
Figure 2.14: Video Delay Variations When Competing With TCP Flows