
MATLAB uses graphics in all of its figures. All figures consist of objects, each of which is referenced using an object handle. In versions of MATLAB prior to version R2014b, the object handles were unique real numbers that were used to refer to the object. With the new graphics system that was initiated in MATLAB R2014b, the object handles actually store objects, which are derived from a superclass called handle.
Plot objects include graphics primitives, which are basic building blocks of plots, as well as the axes used to orient the objects. The graphics primitives include objects such as lines and text. For example, a plot that uses straight line segments uses the line graphics primitive. More of the graphics primitives will be discussed in Section 12.3. The objects are organized hierarchically, and there are properties associated with each object.
The computer screen is called the root object and is referenced using the function groot (which is short for “graphics root”). When plots are made, they appear in the Figure Window; the Figure Window itself appears on the computer screen. The hierarchy in MATLAB can be summarized as follows:
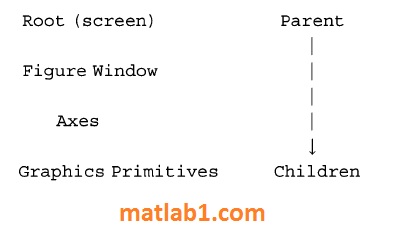
In other words, the Figure Window is in the screen; it includes Axes, which are used to orient graphics primitives, which are the building blocks of plots.
Objects and Properties
A Figure Window is an object; the data in objects are stored in properties. Just calling the figure function will bring up a blank Figure Window and return its handle; by assigning the handle of this Figure Window to an object variable, the properties can then be referenced. For example, if no other figures have been created yet, the following will create Figure (1).
>> f = figure
f =
     Figure (1) with properties:
     Number: 1
     Name:
     Color: [0.9400 0.9400 0.9400]
     Position: [440 378 560 420]
     Units: 'pixels'
     Show all properties
By default only a few of the properties are listed; what is shown are the names of the properties and the values for this instance of the object; these include:
• the figure number: 1
• the name of the figure: none was given so this is an empty string
• the color: given as a vector storing the values of the red, green, and blue components of the color
• the position of the Figure Window within the screen, specified in the units of pixels (which is shown next); this is a vector consisting of four values: the number of pixels that the lower left corner of the Figure Window is from the left of the screen, the number of pixels that the lower left corner of the Figure Window is from the bottom of the screen, the length in pixels and the height in pixels
• the units: pixels
For the Color property, the three numbers in the vector are real numbers in the range from 0 to 1. Zero for a color component means none of that color, whereas one is the brightest possible hue. All zeros represent black, and all ones represent the color white. The default Color property value of [O. 94 o. 94 o. 941] is a very light gray.
By clicking on the “all properties” link, all of the properties can be seen. As long as the Figure Window is not closed, the handle f can be used to refer to the Figure Window; but when the Figure Window is closed, the handle is deleted. Another method of viewing the properties is to pass the handle to the get function as follows.
>>get (f)
Alphamap: [lx64 double]
BeingDeleted: 'off'
BusyAction: 'queue'
ButtonDownFcn:
Children: [OxO GraphicsPlaceholder]
Clipping: 'on'
CloseRequestFcn: 'closereq'
Color: [0.9400 0.9400 0.9400]
Colormap: [64x3 double]
CreateFcn:
CurrentAxes: [OxO GraphicsPlaceholder]
CurrentCharacter:
CurrentObject: [OxO GraphicsPlaceholder]
CurrentPoint : [ O O l
DeleteFcn:
DockControls: 'on'
FileName:
GraphicsSmoothing: 'on'
HandleVisibility: 'on'
IntegerHandle: 'on'
Interruptible: 'on'
InvertHardcopy: 'on'
KeyPressFcn: ' '
KeyReleaseFcn: ' '
MenuBar: 'figure'
Name: ' '
Next Plot: 'add'
Number: 1
NumberTitle: 'on'
PaperOrientation: 'portrait'
PaperPosition: [0.2500 2.5000 8 6]
PaperPositionMode: •manual'
PaperSize: [8 . 5000 11]
PaperType: 'usletter'
PaperUnits: 'inches'
Parent: [lxl Root]
Pointer: 'arrow'
PointerShapeCData: [16xl6 double]
PointerShapeHotSpot: [l 1]
Position: [440 378 560 420]
Renderer: •opengl'
RendererMode: 'auto'
Resize: 'on'
SelectionType: 'normal'
SizeChangedFcn: ' '
Tag: ' '
ToolBar: 'auto'
Type : ' figure '
UIContextMenu: [OxO GraphicsPlaceholder]
Uni ts: ' pixels'
UserData: [ ]
Visible: 'on'
WindowButtonDownFcn: ' '
WindowButtonMotionFcn: ' '
WindowButtonUpFcn: ' '
WindowKeyPressFcn: ' '
WindowKeyReleaseFcn: ' '
WindowScrollWheelFcn: ' '
WindowStyle: 'normal'
XDisplay: 'Quartz'
You may not understand most of these properties; do not worry about it! Notice, however, that the Parent of this figure is the Root object and that there are no Children since there is nothing in this Figure Window.
The get function returns a structure consisting of the names and values of the properties; once stored in a structure variable, the dot operator can then be used to refer to the value of a particular property.
>> fstruct = get (f);
>> fstruct.Color
ans =
0.9400   0.9400   0.9400
The get function can also be used to retrieve just one particular property; e.g.,
the Color property as follows.
>> get (f, 'Color')
 ans =
 0.9400   0.9400   0.9400
The function set can be used to change property values. The set function is called in the format:
set (obj handle, ' PropertyName ' , property value)
For example, the position of the Figure Window could be modified as follows.
>> set (f, 'Position', [400 450 600 550])
Another method for referencing or changing a property of an object is to use the dot notation. The format for this is:
objecthandle.PropertyName
This method is new as of R2014b and is an alternative to using get and set. Using the dot notation is preferable to using get and set since the handles are now objects and this is the standard syntax for referencing object properties.
For example, the following stores the current value of the Color property in a variable and then modifies the Color property to a darker gray.
 >> c= f.Color
     C =
          0.9400 0.9400 0.9400
 >> f.Color = [0.5 0.5 0.5]
Note that this is the same as the notation to refer to a field in a structure, but it is not a structure; this is directly referencing a property within an object. This can be confusing, so here is a review of the variables that have been created:
• The variable f is the handle of the Figure Window object. Objects have properties, which contain the data. Object properties can be referenced using the dot operator,
e.g., f.Name.
• The variable fstruct is a structure that contains the names and values of the properties. Fields in structures can be referenced using the dot operator,
e.g., fstruct.Name.
>> f.Name
ans=
    ' '
>> fstruct.Name
ans=
    ' '
>> f.Name = 'FWTitle'
f =
       Figure (2: FWTitle) with properties:
       Number: 2
       Name: 'FW Title'
       Color: [0 . 9400 0 . 9400 0.9400]
       Position: [440 378 560 420]
       Units: 'pixels'
       Show all properties

>> fstruct.Name
ans=
    ' '
For the figure object stored inf, its built-in class is matlab.ui.Figure; “ui” is the abbreviation for “user interface” and is used in many graphics names. This can be seen using the class function.
>> class (f)
ans =
matlab.ui.figure
The class of fstruct, on the other hand, is struct:
>>class (fstruct)
ans =
struct
Recall that a class definition consists of the data (properties) and functions to manipulate the data (methods). There are built-in functions properties and methods that will display the properties and methods for a particular class.
For example, for the figure referenced by the handle f, we can find the properties; note that they are not listed in alphabetical order as with get and that only the names of the properties are returned (not the values).
>>properties (f)
Properties for class matlab.ui.figure :
Position
Units
Renderer
RendererMode
Visible
Color
etc.
The methods for the figure fare as follows.
>> methods (f)
Methods for class matlab.ui.Figure:

Figure                clo             double                horzcat                reset
addlistener           details         eq                    isprop                 set
addprop               disp            findobj               java                   vertcat
cat                   display         get                   ne
Static methods:
loadobj

Methods of matlab.ui.Figure inherited from handle.
Again, much of this will not make sense but notice that the methods are derived from the superclass handle. The methods, or functions, that can be used with the object f include get and set. Also, the methods eq and ne are defined; these are equivalent to the equality (==) and inequality (~=) operators. That means that the equality and inequality operators can be used to determine whether two figure handles are equal to each other or not.
The various plot functions return a handle for the plot object, which can then be stored in a variable. In the following, the plot function plots a sin function in a Figure Window and returns the object handle. This handle will remain valid as long as the object exists.
>> x = -2*pi: 1/5 : 2*pi ;
>> y =sin (x);
>> hl =plot (x, y)
hl =
Line with properties:
Color: [00.44700.7410]
LineStyle: ' - '
LineWidth : 0.5000
Marker: 'none'
MarkerSize: 6
MarkerFaceColor: ' none'
XData: [lx63 double]
YData: [lx63 double]
ZData: [lxO double]
Show all properties
Notice that the plot is generated using the line graphics primitive. As with the Figure Window, the properties can be viewed and modified using either the dot notation or using get and set. For example, we can find that the parent of the plot is an Axes object.
>> axhan = hl. Parent
ans=
Axes with properties:
XLim: [-8 8]
YLim: [-11]
etc .
The objects, their properties, what the properties mean, and valid values can be found in the MATLAB Help Documentation. Search for Graphics Object Properties to see a list of the property names and a brief explanation of each. For example, the Color property is a vector that stores the color of the line as three separate values for the Red, Green, and Blue intensities, in that order. Each value is in the range from 0 (which means none of that color) to 1 (which is the brightest possible hue of that color). In the previous plot example, the Color was [0 0.4470 0.7410], which means no red, some green, and a lot of blue; in other words the line drawn for the sin function was a royal blue hue. More examples of possible values for the Color vector include:

Changing the line width in the figure makes it easier to see the line and its color, as shown in Fig. 1. Also, tab completion is available for class properties and methods; e.g., if you are not sure of the exact property name for the line width, typing “hl.Li” and then hitting the tab key would display the options.
>> hl.LineWidth = 4;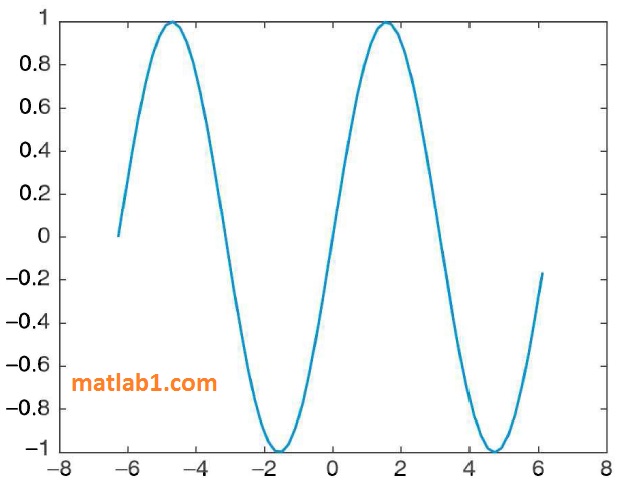
In addition to handles for objects, the built-in functions gca and gcf return the handles for the current axes and figure, respectively (the function names stand for “get current axes” and “get current figure”). In the following example, two Figure Windows are opened. The current figure and the current axes are the most recently created.
>>x =-pi: O.l:pi;
>> fl =figure (1);
>> pl =plot (x, sin (x));
>> f2 =figure (2);
>> p2 =plot (x , cos (x), 'Color', [O 1 1)) ;
>> curfig = gcf
curfig =
Figure (2) with properties:
Number: 2
Name: ' '
Color: [0.9400 0.9400 0.9400]
Position: [440 378 560 420]
Uni ts: 'pixels 1
Show all properties
This Children property of the current figure stores the axes that orient the plot; these axes are also returned by the gca function.
>> curfig.Children
ans =
Axes with properties:
XLim: [-4 4]
YLim: [-11]
XScale: 'linear 1
YScale: 'linear 1
GridLineStyle: '-'
Position: [0.1300 0.1100 0.7750 0.8150]
Units: 'normalized'
Show all properties
>> curfig. Children;; gca
ans =
    1
Within the axes, the Line primitive was used to create the plot. This can be referenced using the dot operator twice. The variable curfig stores the handle of the current figure; its Children property stores the current axes, and the Children property of the axes is the Line primitive.
>> curfig.Children.Children
ans =
    Line with properties:
    Color: [011]
    LineStyle: '-'
    LineWidth: 0.5000
    Marker: 'none '
    MarkerSize: 6
    MarkerFaceColor: 'none'
    XData: [lx63 double]
    YData: [lx63 double]
    ZData: [lxO double]
    Show all properties