Tomographic Segmentation
To extract quantitative information from a tomographic reconstruction, it is often segmented first. Segmentation refers to the act of classifying image pixels into a few distinct classes based on a certain characteristic, typically their grey level. Practically speaking, it answers the question: “Which pixels of the reconstructed image belong to which structure?”
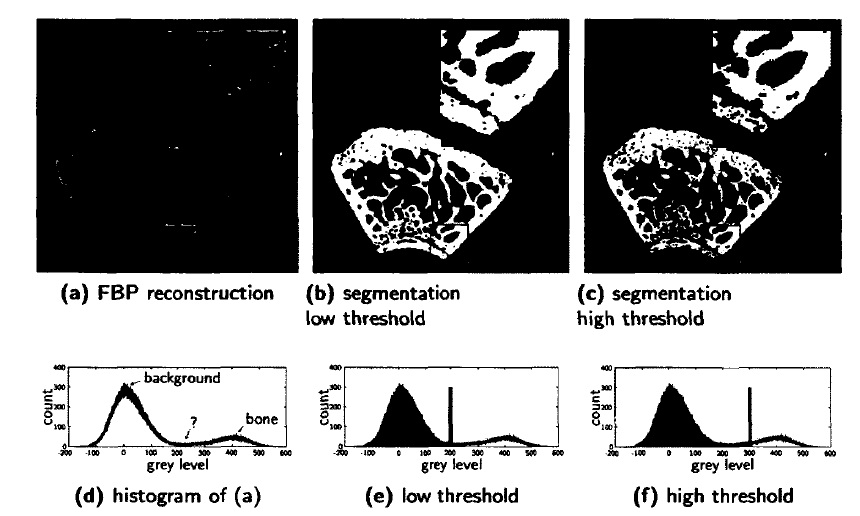
Figure 1: (a) An FBP reconstruction of a rat femur. The scan was made in a SkyScan 1172 /zCT scanner with a camera pixel size of 11.73/xm. 368 projection angles were used, (b-c) Segmentations of (a) with a low and high threshold value, (d) Histogram of (a) (e-f) threshold values of (b) and (c) visualized on the histogram
Consider Fig.1a, an FBP reconstruction of a rat femur from 368 equiangular cone beam projections, scanned with a SkyScan 1172 fiCT scanner. The reconstructed image has a continuous grey scale1 and while creating a segmentation of this image may look trivial at first, a close-up view reveals several pixels especially those at the border of the object that cannot be easily attributed to either the foreground or the background. This is also visible in Fig1d, the histogram of Fig.1a. Two peaks clearly represent the pixels of the background and of the bone, but there are also many pixels whose grey level lies in the middle.It is especially for these pixels that an accurate segmentation technique is required.In the literature, a multitude of segmentation algorithms have been described. Some methods are region-based, e.g. watershed segmentation and region growing. In other methods, object structures are modelled with active contours or snakes. Presumptively the simplest, yet most widely used technique, is
thresholding. However, with thresholding, the accuracy of the segmented images is determined by the chosen threshold values. In Fig.1b and Fig.1.c, twodifferent threshold values have been applied to Fig.1a (the threshold values are also visualized in the histograms shown in Fig1e and Fig1.f). This showsthat even a seemingly small change in threshold choice can have a large effect on the outcome. To select the optimal threshold, several algorithms have been proposed .Histogram shape-based, methods consider the shape of the histogram and use this information to locate its peaks (the grey levels of the classes) and valleys (the threshold values). Clustering-based methods divide the histogram into several clusters (one for each class). This can be done by numerous methods. With Expectation Maximization (EM) the histogram is modelled with parametric basisfunctions such as Gaussian Mixture Models (GMM) . With k-means clustering, each pixel is attributed to the class whose nearest mean it is closest to . With the iterative Otsu’s clustering method, the weighted sum of intra-class variances is minimized. Entropy-based methods do not make use of the histogram. Instead, they attempt to maximize the entropy between the foreground and background pixels or to minimize the cross-entropy between the reconstruction and the segmentation . Most thresholding techniques provide satisfactory results only if the contrast between two materials is sufficiently large. If this is not the case, the grey level distributions of each class overlap too much. Also, small objects (e.g. micro calcifications in medical scans), Eire easily ignored as their contribution in the histogram is barely noticeable. For tomographic applications, advanced schemes are typically used that combine classical segmentation methods with additional post-processing steps. As an example, in, segmentation of lung tissue is proposed as a three step algorithm containing (1) thresholding and a sequence of morphological operations to extract the lungs from the scan, (2) a region-growing method to detect the large airways, and (3) a dynamic programming step to separate the left and right lung. In,lung lobe segmentation is performed with an atlas-driven approach. None of the methods here described contain an inherent measure to assess the accuracy of the segmented image. Furthermore, they are all solely based on the reconstructed image (Fig1a). As seen in Section 1.4, such a reconstructed image is prone to several types of reconstruction artefacts that might obstruct accurate threshold selection. In, a threshold selection method, called Projection Distance Minimization (PDM), was introduced that uses the projection data to determine the optimal threshold value. Such a method is referred to as an tomographic segmentation technique. Note that this method effectively transforms the tomographic workflow to Fig1b.
