Thermal Sensation Analysis
In this post, we talk about Thermal Sensation Analysis.
Thermal sensation is one of the important inputs for regulating the heater’s operation. Inparticular, the temperature measurement is critical factor when the target person enters the desk area because overheating can occurs when the person does not move for a long period of time. Overheating can damage person’s clothes and skin, along the uncomfortable thermal sensation. Therefore, temperature around a user must be monitored and adjusted to prevent the overheating problem.
In Figure , identify the various sizes of the applied heat area in different situations. The results of the thermal sensation differ from one another depending on the movement status and the amount of time we apply heat. next Figure represents the expected temperature changes in various cases for that we assume the room temperature is steady, the same heater is used for the entire experiment and ?0 is the initial body temperature.

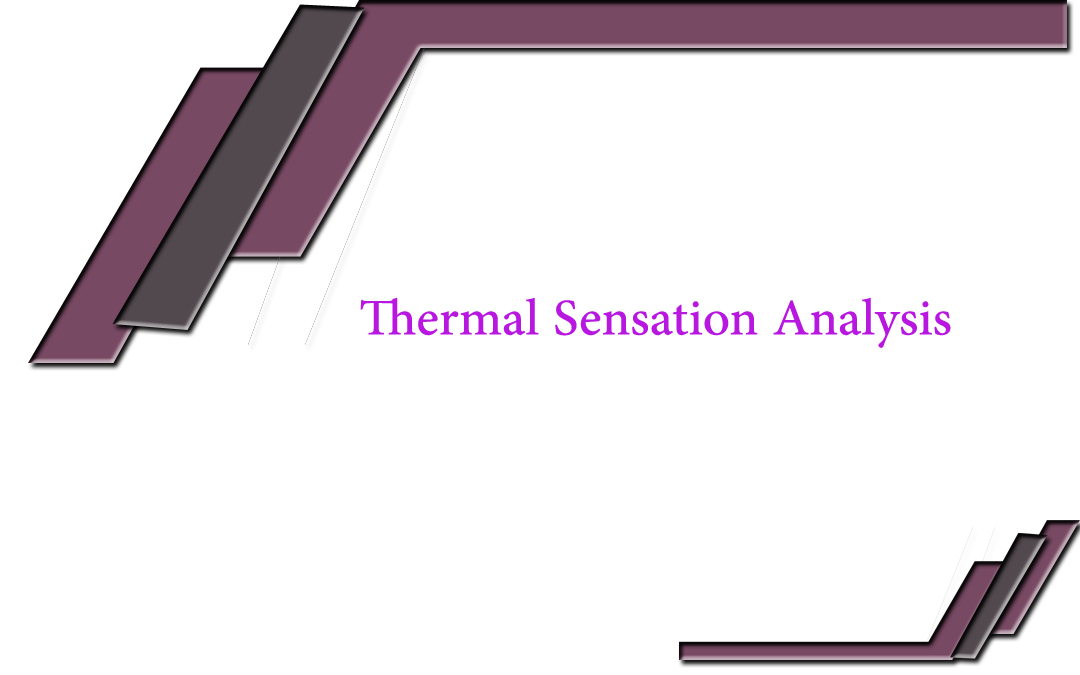
the person sits in the region near the PC and the heater is directly applied to the person. For this situation, the ambient temperature near the target location increases linearly with time until the temperature gets to the stable point. Figure shows the typical result when applying heat to a fixed surface area for a time period based on the Newton’s Law of cooling and heating. After the dead zone, the temperature on the surface increases continuously until it reaches the maximum temperature limit. In this case, the applied heat may cause some damage person’s skin or clothing if the heater is placed too close or too direct.
On the other hand, the effect of the applied heat changes when the person is moving although the heater focuses on the target region of the person. As shown in Figure 1(b), the heat affected areas of the person’s body are changing continuously depending on the distance. The strength of the heat also diverges. Therefore, the effect of the heat has a non-linear relationship over time and area. Figure 2 (b) demonstrates the possible results of the different cases when the target person is moving. The cases are created based on the situations that can happen during the SLHC system operation. The situations contain the effect of the varying distance between the heater and the target person, the size of the heat applied area, and the tracking failure of the person’s movement and the response of the system.
In Figure 2 (b), there are 5 sample cases. In the case 1, the distance between the heater and the person is short and the person does not move. The temperature quickly bumps up and reaches a certain desired level. As soon as the person starts to move in the same region, the temperature keeps in the range shown in the case 2. The person gets closer to the heater and the movement gets slower in the case 3. After that, the temperature increases slowly. In case 4, there is the target person’s unexpected movement. The person can move further away unexpectedly from the current target range. For example, the person is moving too quick to be caught by the sensor and the system cannot reach the person. However, the sensor catches the person’s movement and adjusts the heater’s direction later if the person still stays in space. After the sensor re-tracks the person’s location, the temperature starts increasing as shown in the case 5. We can expect various results depending on the diverse environmental settings and thermal sensation level for each individual. Therefore, the feedback information improves the result optimization of the SLHC system operation.