Spike Waveforms
In theory, an action potential waveform or template could be unequivocally and unambiguously linked to a single neuron. However, in practice this is a difficult problem because the recorded signal is non-stationary due to several time varying characteristics of its corresponding source, as well as noise from the recording experimental setup. The recorded spike waveform depends on the neuron morphology, neuron firing characteristics, the recording device characteristics as well as spatial arrangement of the electrode tips in the MEA . For an electrode maintained at a constant position, the spike waveforms recorded for the same neuron would ideally be mostly identical. However, it has been shown that single-unit waveforms can vary according to the time since the last spike was fired . There is only a limited period immediately after a neuron fires in which no action potentials can be produced, commonly referred to as the refractory period. Furthermore, an extracellular recording does not present a perfectly flat baseline, which can heavily impact the signal’s characteristics across time. There are several parameters that can be employed to determine if a spike waveform comes from the same single-unit, but without intracellular recordings, all these methods are indirect. For example, the variability of a waveform from a spike fired by the same neuron with respect to inter-spike intervals (ISI) is depicted in Figure 2.3. These action potentials were fired within 16 ms of each other and present waveforms with divergent width and amplitude. The figure in the middle appears to be most likely the spike average waveform while the side waveforms are deviations in terms of inter-spike intervals in addition to noise. In addition to these inherent neuronal sources of variability, there is also adherent noise from unwanted external factors during acquisition. Some common issues inherent in extracellular recordings that affect the recorded waveform of the action potential involve crosstalk between electrode array channels, micro movement of MEAs, overlapping timing between spikes, critically low SNR, among others . Moreover, the sources of noise can become much more prevalent during an in vivo experiment, where a whole living organism, such as rodent or nonhuman primate, is employed. In particular, the recording quality can be further affected by the electrode-tissue interface impedance and, in the case of an experimental model of injury, the extent of the trauma (edema) and foreign body response. Several attempts have been made to parametrically describe spike waveforms, but most methods fail to capture important features of the waveform including the inherent and external variabilities. For instance, in theory, a spike waveform can be mono, bi-, tri- and even quadphasic
, i.e. it may contain from one to four peaks with interchanging polarities. In addition, the spike waveform has been shown to be strongly influenced by noise and preprocessing filters in the acquisition device , and in low SNR recordings it becomes more challenging to acquire the template information during the training period.
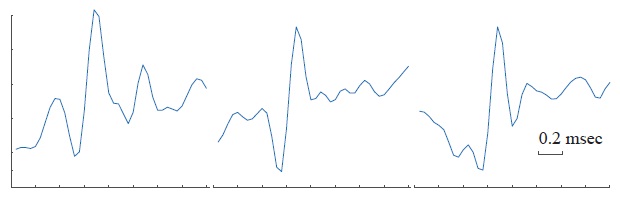
Figure 2.3. Variability of action potential waveforms according to inter-spike intervals. Three different action potentials waveforms lasting 1.6 ms were extracted from the same extracellular recording. The spike waveforms were fired by the same unit at ~16 ms from each other but at different ISIs with respect to the previous spike.

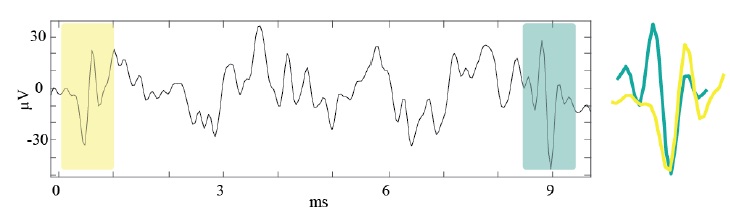
Figure 2.4. Typical extracellular recording from the same electrode (channel) in a MEA in ??? lasting 10 ms at a
sampling frequency ?? ≈ 24???. Two different action potential waveforms from different profiles are highlighted for a period of ~1 ms with peak-to-peak voltages ranging from -30 to 25 ??s and -50 to 30 ??s respectively. The two waveforms depicted on the right most likely correspond to different units given their shape differences.
Figure 2.5. Spike templates for thirty-six single-units recorded from five second segments using a four-shank, sixteen-contact site Michigan-style electrode (A4x4-5mm-100-125-703-A16, NeuroNexus, Ann Arbor, MI). Singleunit waveform templates were calculated by aligning, averaging, and sorting multi-unit waveforms from detected spikes. Even though some single-units across channels in the MEA appear to have similar action potential templates, the templates most likely correspond to different single-units given the distance among the MEA contact points (100 ?? sideways and 125 ?? diagonally).