A sound wave is an example of a continuous signal that can be sampled to result in a discrete signal. In this case, sound waves traveling through the air are recorded as a set of measurements that can then be used to reconstruct the original sound signal, as closely as possible. The sampling rate, or sampling frequency, is the number of samples taken per time unit, for example per second. Sound signals are usually measured in Hertz (Hz).
In MATLAB, the discrete sound signal is represented by a vector and the frequency is measured in Hertz. MATLAB has several MAT-files that store for various sounds the signal vector in a variable y and the frequency in a variable Fs. These MAT-files include chirp, gong, laughter, splat, train, and handel. There is a built-in function, sound, that will send a sound signal to an output device such as speakers.
The function call:
>> sound (y, Fs) will play the sound represented by the vector y at the frequency Fs. For example, to hear a gong, load the variables from the MAT-file and then play the sound using the sound function:
>> load gong
>> sound (y, Fs)
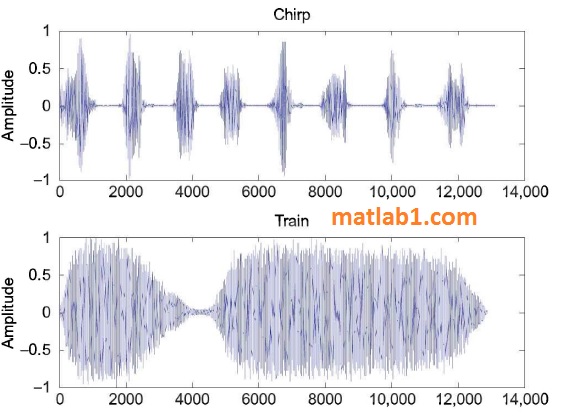
Sound is a wave; the amplitudes are what are stored in the sound signal variable y. These are supposed to be in the range from – 1 to 1. The plot function can be used to display the data. For example, the following script creates a subplot that displays the signals from chirp and from train, as shown in Fig. 1.
% Display the sound signals from chirp and train
subplot(2,l,l)
load chirp
plot(y)
ylabel ('Amplitude')
title ('Chirp')
subplot(2 ,l ,2)
load train
plot(y)
ylabel ('Amplitude')
title ('Train')
The first argument to the sound function can be an n x 2 matrix for stereo sound. Also, the second argument can be omitted when calling the sound function, in which case the default sample frequency of 819 2 Hz is used. This is the frequency stored in the built-in sound MAT-files.
>>load train
    Fs
    Fs =
        8192
Other Interesting Features
Several audio file formats are used in industry on different computer platforms. Audio files with the extension “.au” were developed by Sun Microsystems; typically, they are used with Java and Unix, whereas Windows PCs typically use “.wav” files that were developed by Microsoft.
Investigate the MATLAB functions audioread, audioinfo, and audiowrite.
Investigate the colorcube function, which returns a colormap with regularly spaced R, G, and B colors.
Investigate the imfinfo function, which will return information about an image file in a structure variable.
Investigate how colormaps work with image matrices of types uint8 and uint16.
In addition to true color images and indexed images into a colormap, a third type of image is an intensity image, which is used frequently for grayscale
images. Investigate how to use the image scale function imagesc.
The uibuttongroup function is used specifically to group together buttons; other objects can be grouped together similarly using the uipanel function.
Investigate how this works.
