Scientific research of computational text analysis started in the 1950s when the most advanced computer technology used punched cards and tabulation machines (Stone, 1997). Since then, computational approaches into text and language research have been improving continuously, utilizing the newest technology available at the time and producing several approaches into text analysis starting in the 1960s. Predicting semantic orientation or polarity of texts existed long before the recent adoption of social media. Semantic orientation is defined as an evaluation of the attitude (positive or negative) and its strength towards the subject, idea, or text (Osgood, Suci, & Tannenbaum, 1957). Sentiment analysis is the accepted term that is used to refer to the automatic extraction and analysis of semantic orientation (Taboada, Brooke, Tofiloski, Voll, & Stede, 2011). There were numerous research efforts in the field of sentiment analysis since the emergence of computers and their penetration into technology and science. In 1997, Hatzivassiloglou and McKeown published their work on predicting the semantic orientation of adjectives based on the analysis of large text corpora. They were able to achieve 92% accuracy on the task of classifying adjectives as positive or negative (Hatzivassiloglou & McKeown, 1997, p. 178). Additionally, the authors were able to rank adjectives in a quantitative manner, thus allowing for a further refinement of the simple positive-negative polarity (Hatzivassiloglou & McKeown, 1997, p. 180). This research proved to have important implications for information extraction and retrieval in determining semantic orientation and predicting subjectivity.
Computational linguistics methods of text analysis have been an established approach to determine the attitude of a speaker of a specific text as well as the strength of its polarity. The analysis can be done on a document level and there are multiple ways of determining the document polarity – by the emotional state of the document such as “happy,” “sad” or “angry” or by determining the overall polarity of the text on the scale of [-5, – +5] where -5 is the most negative score and +5 is the most positive one. There are several methods employed in sentiment analysis, such as the compositional semantic approach (Moilanen & Pulman, 2007), Naïve Bayes, Support Vector Machines, maximum-entropy-based classification (Jurafsky & Martin, 2009; Pang & Lee, 2008). Those methods rely on a variety of features such as adjectives and adverbs (Hatzivassiloglou & McKeown, 1997, p. 178; Turney, 2002), “bag-of-words” (Bradley & Lang, 1999) and employ various dictionaries such as SentiWordNet (Bermingham & Smeaton, 2010) and others. “Bag-of-words” is a model of sentiment analysis where each word in a text is assumed to be independent of one another (Joachims, 1997; Jurafsky & Martin, 2009, p. 641). No syntactic links are explored and no semantic hierarchies need to be constructed There are some limitations to this approach, but those are more pronounced when dealing with significant bodies of text. Some of those are: words cannot be distinguished for parts of speech, negation is not handled, and multiple meanings of a word are not taken into account. However, despite those very real limitations, recent research (Yessenov & Misalovic, 2009) suggests that the “bag-of-words” compares well in results with other approaches. Most of the microblogging platforms impose severe restrictions on message size. For example, the maximum message length on Twitter is limited to 140 characters. Sina Weibo imposes the same limitation, although in this case the limitation is 140 Chinese characters, which allows for more informational content when compared to the English equivalent. The size limitations encourage extensive use of ungrammatical forms and unorthodox orthography as well as a wide use of emoticons. At the same time, limitations imposed on message size make some methods used in sentiment analysis less suitable for the task – for example, methods that rely on compositional analysis (Moilanen & Pulman, 2007) will not benefit from a compositional approach because the message is not long enough to have large syntactic constituents that can be assigned a sentiment polarity. For microblogging in particular, where no rich syntax or complicated semantic features can be present, treating each word as a separate unit (unigram) has been shown to produce robust results on sentiment classification. Increasing the unit to anything larger than unigram (bi-grams and on) has been shown to produce the same or worse results, whereas examining the message word by word was able to achieve a high level of accuracy (74.85%) on a wide range of subjects (Bermingham & Smeaton, 2010). Approaching sentiment analysis of microblogs one word at a time implies that Naïve Bayes classifier combined with the “bag-of-words” feature are suitable candidates for the task. Naïve Bayes classifier is a probabilistic classifier that applies Bayes’ theorem with the assumption that the features are conditionally independent (Jurafsky & Martin, 2009, p. 642). Each word in a text is compared against a precompiled word list where each member has been assigned a score for valence. If a word has not been found in the precompiled word list, a score value of 0 is assigned to that word. Once each word has been assigned a score, the text collection (such as a message or sentence) is assigned a total score by the summation of scores that has been assigned to each member of the collection – if a word J is an element of collection T, and the sentiment score for word J is S(J), the collection’s score is calculated as S(T) = ΣS(J) for J ∈ T. Over the years, several lists of words with their assigned sentiment score, also known as “affective word lists” or ANEW, have been assembled. The original ANEW (Affective Norms for English Words) list of words with their sentiment score was complied and published in 1999 by Bradley and Lang. The list was developed to “provide a set of normative emotional ratings for a large number of words in the English language” (Bradley & Lang, 1999, p. 1). This effort resulted in a list with 1,034 words ranked for their sentiment that included verbs, nouns, and adjectives. The ANEW list was used extensively in sentiment analysis; however, with the emergence of new models of interaction such as microblogging, the words that are most commonly encountered in tweets are no longer corresponding to word frequencies as established in the original ANEW list. Nielsen (2011) presents two new lists of affective words, AFINN-96 and AFINN- 111, which have been constructed specifically for microblogs. The new lists are shown to perform better on the sentiment analysis of microblogs than the traditional ANEW list that was developed prior to microblogging and social media. The AFINN-96 contains a list of 1,468 unique words and phrases that are scored for their sentiment valence. The AFINN-111 is the newer and more extended version of AFINN-96 and contains 2,477 words and phrases. Additionally, the “bag-of-words” approach, when implemented with AFINN word list, has been found to perform better than Bayesian Network approach (Nagy & Stamberger, 2012) for Twitter messages. The choice of the “bag-of-words” approach combined with AFINN for word list polarity is justified in attempting to determine the sentiment and polarity of Twitter messages. In order to examine how successful various computational approaches are in comparison with human evaluation for the purpose of sentiment analysis, a subset of the corpus is given to human raters to score. The results of human raters are subsequently compared with the machine-produced results. However, when multiple human raters are asked to rate the same text, they might not be in a complete agreement of either the emotional state or the polarity of the text. When the raters are asked to group the text into mutually exclusive categories, the agreement between them is defined as inter-rater agreement. Inter-rater agreement is statistically measured by the Kappa (κ) coefficient. Kappa measures the consensus between two raters while excluding the probability of a chance agreement between them. If the agreement between raters is not more than a chance agreement then the Kappa value is 0, while complete agreement between two raters produces the Kappa value of 1 (Cohen, 1968). Agreement scores of 75% to 82% (Kappa value of 0.75) for a variety of scoring tasks on texts have been considered the norm (Wiebe, Wilson, & Cardie, 2005, p.36; Kessler & Nicolov, 2009, p. 93). Other researchers report similar or slightly lower agreement levels – depending on the task and the corpus that was put for the human annotators to score such as newspaper articles vs. consumer reviews (Toprak, Jacob & Gurevych, 2010). Since the industry-accepted results for inter-rater agreements are never 100%, a similar agreement level of 75% between machine-produced results and human produced results is considered a positive outcome of the computational approach. Whereas initially text analysis in general and sentiment analysis in particular relied on large texts such as newspaper articles, books, and other published content, recent emergence of social media and microblogging has brought a wealth of user generated content on a variety of topics and in a multitude of formats in a much less formalized pattern. Consequently, numerous research efforts have been dedicated to the analysis in this new area. There is an abundance of platforms for user generated content such as various review sites for movies, books, products, and social interaction sites including MySpace, Facebook, Twitter, and other microblogging and blogging platforms. Many research efforts have been dedicated to analyzing the contents that users are producing, the utilization of various analysis methods, and the applicability of those results to the diverse needs of communication and information exchange. Turney (2002) suggested a “simple unsupervised learning algorithm for classifying reviews as recommended (thumbs up) or not recommended (thumbs down)” that relies on the identification of adjectives or adverbs using a part-of-speech tagger. Phrases were scored to determine either positive or negative semantic orientations. Thus, the reviews that were marked as belonging to the positive reviews class were predicted to contain a recommendation for an item reviewed. The rest of the reviews were predicted to not contain recommendations. According to the study, the accuracy rates on classification of movie reviews were about 66% but on classification of reviews for banks and cars, accuracy rates of 80% to 84% were achieved. Pang and Lee (2008) provide an in-depth review of various approaches and methods in sentiment analysis and opinion extraction. The authors also provide potential applications for sentiment analysis as well as some of the implications that can arise from those technologies. Additionally, the authors provide a list of available resources such as variety of datasets, ways to acquire labels for the data, a list of lexical resources, and access to the bibliographic database used in their survey. Thelwall, Buckley, Paltoglou, Cai, and Kappas (2010) propose a new algorithm for sentiment analysis. SentiStrength is described as an approach “which employs several novel methods to simultaneously extract positive and negative sentiment strength from short informal electronic text. SentiStrength uses a dictionary of sentiment words with associated strength measures and exploits a range of recognized non-standard spellings and other common textual methods of expressing sentiment “. The algorithm was developed on yet another social networking site, MySpace, which is mostly used by young members using informal communication patterns. MySpace was one of the most popular social networking sites in 2009, but lately with the gain in popularity of Facebook, it has been much less visited. Taboada et al. (2011) suggest that the lexicon-based approach that assigns polarity and strength to individual words performs consistently well when compared with statistical text classifiers that need to be trained for each domain they are operated on. The Semantic Orientation CALculator (SO-CAL) dictionary is based on extracting “sentiment bearing words (including adjectives, verbs, nouns, and adverbs), and use them to calculate semantic orientation, taking into account valence shifters (intensifiers, downtoners, negation, and irrealis markers)” (Taboada et al., 2011, p. 270), but this time there is no limitation for the extraction of only adjectives and adverbs. The study compares the SO-CAL dictionary with other dictionaries created in previous studies, such as the SentiWordNet and Maryland dictionary (Taboada et al., 2011, p. 293 – 299). When trying to come up with the optimal sentiment analysis approach, it is necessary to evaluate the datasets in question. The vast dissimilarity across diverse characteristics of various datasets such as movie reviews and MySpace comments vs. microblogging messages lead to different optimal approaches in sentiment analysis when applied to a particular dataset. Microblogging messages are characterized by their extreme limitations on length, ungrammatical and incorrect spellings, and other unique characteristics. The nature and limitation of Twitter messages are further complicating the task of statistical classifiers since the messages might contain ungrammatical forms of words (such as omitting tense of verbs) or are written in Twitter-like shorthand (such as elimination of vowels in derivational suffixes). The emergence of Twitter as the major platform for research has several underlying reasons. First and foremost, the convenience of accessing the messages using programmatic interface allows researchers to create programs that automate message collection. Next, the sheer quantity of publicly available messages allows a sufficient amount of messages to be collected within a reasonable amount of time. Next, the possibility of slicing the messages according to their subject hashtag, language, geographical location of posters, and other criteria has been instrumental in allowing researchers to concentrate on their areas of interest. Kaplan and Haenlein (2011) investigate the reasons for the popularity of Twitter as a microblogging platform, its increased importance as a source of news, and its emergence as a platform for users to exchange information and to interact. The authors suggest that the nature of the push and pull mechanism, as well as the immediacy of postings, is among the contributing factors leading to the emergence of Twitter as a global communication platform. In their paper the authors describe what microblogging is, how it fits into the social media class, and the reasons behind its popularity and wide adoption. Despite the very real limitations imposed by the paltry 140 characters size of the messages, there are various characteristics that compensate for this deficiency and promote the usage of Twitter as a communication platform of choice for individuals and as a result of that, for companies as well. The authors discuss possible uses of Twitter for the various purposes of marketing research, communications, and customer service, thus opening up a wide and very real practical application in the domain of sentiment analysis. One of the possible practical uses for sentiment analysis is presented by Cheong and Lee (2010). They suggest combining sentiment analysis with metadata analysis and geographical location using Twitter Streaming and Search API and hashtags. The authors propose a sentiment analysis approach that relies on a predefined list of categories and their associated keywords that can be relevant for terrorism detection. While the individual keywords and categories that the authors propose are somewhat
limited for a general sentiment analysis approach, their work illuminates the practical need and usefulness of sentiment analysis on a given subject, as well as the inclusion of hashtags in determining the direction and polarity of messages. O’Connor, Balasubramanyan, Routledge, and Smith (2010) suggest that there is a correlation between the public opinion polls and sentiment analysis of microblogs using word frequencies. They argue that retweeted, or retransmitted messages should be discarded from the analyzed collection and that the lexicon used for the sentiment analysis be increased. Wilkinson and Thelwal (2012) present a study of trending Twitter topics that is based on comparisons of 50 trending keywords found in 500 million tweets collected from various English speaking countries such as the USA, the UK, India, South Africa, and others. The authors describe criteria for the specific data collection, including utilizing information provided by users in their Twitter profiles combined with specific geographic areas, as well as provide analysis approaches for the collected messages. Zappavigna (2011) describes how the hashtags have evolved into becoming the linguistic markers that allow Twitter users to classify their content in a manner that gives others the ability to analyze and evaluate it. The hashtag is viewed as a factor assisting in microblogging discourse analysis. Efron (2011) reviews various methods of accessing microblogs and the problems associated with search and sentiment analysis. Go, Bhayani, and Huang (2009) present an approach to automatically classify the sentiment of Twitter messages based on emoticons that are included in the message.
They report that the use of machine-learning algorithms has achieved an accuracy of 80% in sentiment detection. The authors also include a list of required preprocess steps that are necessary to analyze the data. That said, to base the sentiment analysis solely on the emoticons would lead to ignoring a significant amount of data that is available in the tweets, as well as disregarding altogether all the tweets that do not carry any emoticons. Kouloumpis, Wilson, and Moore (2011) use the emoticons data produced by Go et al. (2009) in their evaluation of the usefulness of various linguistics features for the detection of sentiment of Twitter messages. Kouloumpis et al. (2011) illustrate that emoticons prove to be of a lesser value to sentiment analysis than hashtags; however, this research relies on a restricted set of hashtags, while ignoring all the hashtags not on their list. Asur and Huberman (2010) show that Twitter data can be used to predict box office revenues for movies – their results outperform existing market-based predictors. The rate of creation of tweets prior to a movie release date can indicate the future success of a movie. When the rate of creation is combined with the sentiment analysis of the tweets, there is an improvement in the prediction value of the model. The authors further suggest that the same model can be employed in predicting outcomes of elections, as well as various product ratings. Davidov, Tsur, and Rappoport (2010) present a supervised sentiment classification framework that uses emoticons and a predefined set of Twitter hashtags as sentiment labels. Contributions of different feature types are investigated. In the course of their work, 50 hashtags and 15 smileys (emoticons) were used as sentiment labels. In addition to using individual words in sentences, the authors also use word sequences of 2 to 5 words (n-grams), as well as smileys that are considered equivalent to words for the purpose of sentiment analysis. However, the authors are evaluating only the 50 most frequently encountered hashtags that were annotated by human raters and use only those hashtags for sentiment analysis purposes. Additionally, tweets containing more than one of the hashtags from the list were excluded from the study. The authors note that many tweets contain more than a single hashtag, and that tweets in general contain many more hashtags than the selected 50 that were being used; therefore, additional evaluation of hashtags to sentiment analysis would be beneficial. Hansen, Arvidsson, Nielsen, Colleoni, and Etter (2011) use the new list of affective words AFINN-96 in their investigation of how affect influences virality on Twitter. The study shows that “negative sentiment enhances virality in the news segment, but not in the non-news segment” (Hansen et al., 2011). Virality is defined as the probability that the tweet containing a link is retweeted, and the study finds that “negative news content is more likely to be retweeted, while for non-news tweets positive sentiments support virality” (Hansen et al., 2011). The authors analyze several collections: all the tweets on the subject of COP15 climate summit, a random sample of tweets, and BROWN, which is a text corpus containing both news and non-news documents (Nelson & Kucera, 1979). None of the literature surveyed so far has attempted to treat the hashtag as the powerful feature that it is. The hashtag allows users either to use values that are already existing, or to create their own as they see fit in order to express themselves in the best possible way while still restricting the content to 140 characters. The studies that did look at hashtags have restricted their use either as an expression of plain emotional content without a lexical component such as emoticons, or as a trend or keyword component that is used to segregate the tweets stream into consumable chunks. An examination of hashtags without trying to impose any constraints on its contents might be beneficial for the better understanding of sentiment analysis of microblogging.
Methods
In order to analyze the contribution of hashtags to the sentiment score of the tweets several components were required. The data collection component is dedicated to the collection of tweets, their filtering based on relevant criteria, and their subsequent storage to be used in the data analysis stage. The data analysis component performs various analyses and calculates sentiment scores. The end result of the data analysis component is a collection of tweets with two sentiment scores assigned to each tweet. Figure 4 illustrates the flowchart of the methods used.

Methodology Flowchart
Each component is described in further details in the following sections.
Data Collection
Twitter provides the means that enable and encourage external developers to create tools and establish businesses that rely on Twitter as a communication platform. The data collection component uses a Python script to collect 1% of publicly available tweets using Twitter Streaming API. During the collection process, retweets, which are re-postings of someone else’s tweet, were discarded. Likewise, an attempt was made to only receive tweets in English by specifying English as the language code in the API parameters. The language setting in the API parameters is not a guarantee of the specific language of the tweet of itself, but rather reflects the language preferences as set by users in their profiles. Therefore, tweets in languages other than English can be delivered intermixed with tweets in English. In order to prevent the collection of tweets in other languages, a disambiguation attempt was performed on each message in which words in a tweet were checked against a list of most common Spanish words and a list of most common Indonesian words. Spanish and Indonesian languages were selected for filtering due to numerous complaints of Twitter developers of tweets in those languages being forwarded by the API despite English being selected as the requested language. Tweets that contained words from either of those two lists were discarded. Figure 5 illustrates the data collection process.
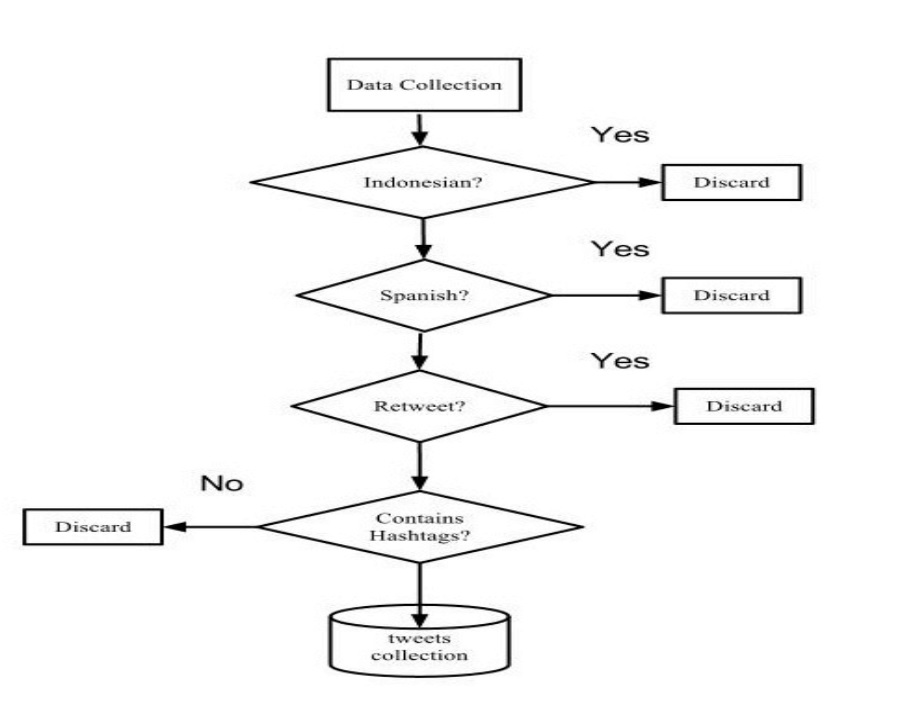
Data Collection Flowchart
The data collection process was run intermittently between June, 2012 and September, 2012. An effort was made to avoid collection during the London Olympics 2012, because the event was affecting a great number of messages and trends and so was likely to take a big share of the 1% of all public tweets that are available via Twitter Streaming API. A total of 1,812,784 tweets were collected. Of those, 308,112 (or about 16.99%) tweets contained hashtags and thus were of interest to the subject of this research. Tweets that contained hashtags were selected from all the collected tweets and copied into separate files for data analysis.
Data Analysis
The “bag-of-words” approach was used to calculate the sentiment score of the tweets. In order to investigate the contribution of hashtags to the overall sentiment score of the tweet, each tweet was scored for sentiment twice – once without including the hashtags and once with hashtags. A Python script was used in order to perform the sentiment score analysis and the disambiguation or translation of the hashtags value for sentiment score calculation purposes. Figure 6 presents the data analysis flowchart diagram.

Data Analysis Flowchart
Hashtag Analysis. Since the hashtags could contain any type of text such as a number, a date, a word, several words concatenated into one, or an acronym, the first step was to verify the validity of the hashtag and to attempt to translate those hashtags that were not intelligible for sentiment analysis purposes. Figure 7 provides a diagram of hashtag analysis that had to be performed.
Hashtag Analysis Flowchart