Pilot fatigue has been proven to be the cause of many aviation accidents. Fatigue introduces error into the pilot’s inputs, which can potentially lead to accidents. To date,fatigue has been widely researched through physiological variables and sleep studies.
Often, systems monitoring physiological variables would require constant physical contact with the pilot during flight. This arrangement could be cumbersome to pilots, and may hinder their flying ability even more. These systems will also add unnecessary weight to the aircraft, which could lead to increases in fuel consumption. Sleep studies have been investigated in an attempt to determine causes of pilot fatigue based on the amount and quality of sleep they have received pre-flight, but they only serve for fatigue prevention purposes.
The main objective of this research effort is to show that separation between‘rested’ and ‘tired’ pilot conditions can be put into evidence using parameters based on aircraft state and control variables and to design a fatigue detection scheme to determine the ‘on-line’ state of the pilot for a set of typical maneuvers.
Five pilots were instructed to fly a 6 degrees-of-freedom flight simulator through a given flight scenario under ‘rested’ and ‘tired’ conditions. State and control variables such as aircraft roll rate, angle of attack, elevator deflection, and others were recorded during flight. The desired values of these variables were determined depending on what maneuver the pilot was trying to accomplish. Steady state flight conditions and doublet inputs in still air and turbulence were considered in this study. Tracking errors were defined as the difference between the actual variable value and the desired value.
Standard deviation and mean of the tracking errors were considered as candidate fatigue detectors and their performance was analyzed. The most promising detectors were then used to define composite detection parameters as weighted sums. Two detection schemes were designed to determine the ‘rested’ or ‘tired’ state of the pilot based on comparing the composite parameter values to a threshold. The first scheme used heuristic and binary logic to define a series of rules hard coded through ‘if else’ statements capable of determining the pilot’s condition. The second detection scheme relied on fuzzy logic to make a ‘rested’ or ‘tired’ determination. Results showed that both schemes were capable of correctly classifying the condition of the pilot for many maneuvers. The detection schemes performed the best for the maneuvers performed in still air, but the detection rate was reduced when severe turbulence was present. A third approach of fatigue detection was investigated through implementation of a fuzzy neural network, and positive preliminary results deemed this method worthy of further exploration.
The analysis in this study presented compelling evidence that fatigue detection can be accomplished through the monitoring of aircraft state variables. Further research into using these detection schemes in conjunction with a flight compensation system may prove to be a viable, cost-effective intervention for reducing the number of accidents attributed to pilot fatigue.
Fatigue Literature
“On August 18, 1993, at 16:56 eastern daylight time, a military contract flight crashed while attempting to land at the U.S. Naval Air Station, Guantanamo Bay, Cuba. The airplane, a Douglas DC-8-61 freighter, was destroyed by impact
forces and fire. The three flight crewmember sustained serious injuries. The National Transportation Safety Board (N.T.S.B) an independent agency of the United States government, conducted an official investigation to determine the cause of the accident and make recommendations to prevent a recurrence. The individual crew members had an acute sleep loss (i.e., 5, 6, 8 hrs of daytime sleep) and were continuously awake 19, 21, and 23.5 hours prior to the accident…”
Rosekind Gregory, 3.“Hundreds of pilots, mechanics and air-traffic controllers reported that fatigue led
them to make mistakes on the job, including six cases where pilots fell asleep in mid-flight. The reports show that crews flew to the wrong altitude, botched landings and missed radio calls, according to an aviation safety database compiled
by NASA. In one case, a pilot and co-pilot fell asleep while descending toward Dulles International Airport near Washington, D.C…” -USA Today 4.
As these two quotes illustrate, fatigue is a leading cause of pilot error. These errors can lead to serious accidents and even death. Since fatigue continues to appear in accident reports as a probable cause, a substantial amount of research is being focused on its prevention and detection. In researching previous fatigue studies, the following three
topics of investigation would more or less categorize all prior efforts: (1) Causes of Fatigue, (2) Mathematical Human Operator Models, and (3) Physiological Monitoring. The National Aeronautics and Space Administration’s (NASA) Ame Research
Center developed the Fatigue/Jet Lag Program in 1980 in response to a congressional request. The program was created to collect information on fatigue, sleep, circadian rhythms, and performance in flight operations 5. In 1999 the group changed its name to the Fatigue Countermeasures Group to emphasize more importance on combating
fatigue. According to a speech given by Michael Mann at the NASA Hearing on Pilot Fatigue before the Aviation Subcommittee of the Committee on Transportation and Infrastructure on August 3, 1999…there is a safety problem of uncertain magnitude, due to trans-meridian flying and a potential problem due to fatigue in association with various factors found in
air transport operations. A NASA/FAA countermeasure study empirically demonstrated the effectiveness of a planned cockpit rest period in improving performance and alertness in long-haul flight operations.” However, “given that
fatigue is a safety issue in aviation, the next logical question is how to address it. Unfortunately, there is no one simple solution. Fatigue is a problem with diversecauses, requiring a multi-faceted and comprehensive yet integrated approach.
Based on current research, such an approach should have at least the following components: (a) education and training, (b) hours of service, (c) sound scheduling. practices, (d) effective countermeasures, (e) incorporation of appropriate design
and technologies, and (f) research.”
The quote mentions general fatigue awareness as a probable countermeasure. However, even given its merits, this approach will not completely solve the problem. Another research area revolves around determining contributing factors leading to
pilot fatigue. Elements such as sleepiness, time since last sleep, and quality of sleep have been extensively researched. One product of these fatigue studies was the QinetiQ Alertness Model 6. The study consisted of having 30 subjects participate in an isolated laboratory sleep and work study. Participants were given specific work and sleep schedules to adhere to while avoiding any possibility of encountering sleep deprivation.
The schedule consisted of work periods of six, 12, and 18 hours which were balanced for
time of day6. During the work cycle, alertness assessments were made every two hours 6 The results of the experiment were twofold. Conclusions were made on alertness levels based on (1) how long it had been since last sleep, and (2) what time of day the participant woke up. According to the model (Figure 2.1), the dark red area correlates to a ‘tired’ individual, and the dark green portion correlates to a ‘rested’ individual. The study suggests that when the participants wake up around 15:00 and have been awake for nearly three hours they will be at their peak alertness. The least level of alertness was
determined to be when the individual awoke around 15:00 and had been awake for nearly 16 hours. The alertness model was used as part of this research effort in scheduling when the test pilots would perform their ‘rested’ and ‘tired’ flights.
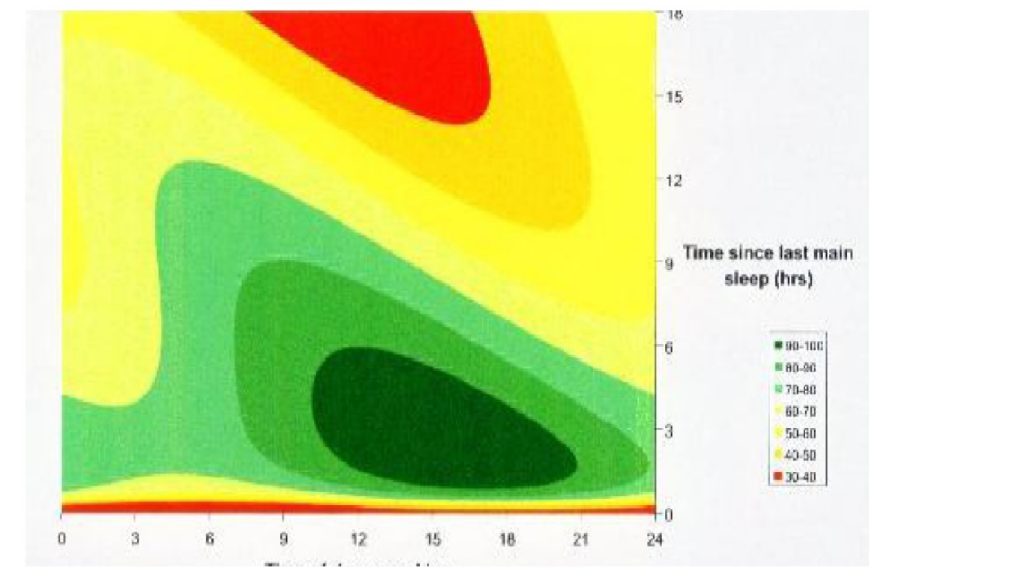
graphical representation of CHS alertness model
Other tools have been developed based on these types of studies such as the Fatigue Avoidance Scheduling Tool 7 (FAST) which makes fatigue predictions that assist operator scheduling. The FAST tools based on the Sleep, Activity, Fatigue and Task Effectiveness model, developed by Dr. Steven Johns Hopkins University, which uses duration and quality of sleep as metrics to predict cognitive.
performance effectiveness. The model can also account for variables such as balance between sleep and wakefulness, sleep inertia, and circadian rhythms. This model has been under development for more than a decade and now Dr. johens is under contract to the Warfighter Fatigue Countermeasures R&D Group Inc. to modify and expand the model 8.Other research has attempted to mathematically model the human operator. According to McRuer and Krendal the greatest amount of information exists for the single-loop case when the pilot is giving his full attention to one control task. They have shown that because many problems involve one dominant axis, this single loop configuration has been a highly productive modeling approach. This particular model is known as the crossover model9. Other more complicated models include the algorithmic optimal control model10,11 and the isomorphic pilot model12. These models are used for more complex tasks where multiple inputs are considered and therefore a single loop configuration cannot account for the extra inputs accurately.
Mathematical models could be useful in the context of fatigue detection because they provide information on how fatigue may affect performance and suggest parameters that can be determined from input/output measurements using parameter identification techniques13. One such parameter would be pilot delay. It is expected that in the presence of fatigue the pilot’s response time would increase causing this delay parameter to be larger in magnitude. A second parameter that could be extracted from these models as a potential fatigue indicator is response time bandwidth of the pilot and aircraft
system. A larger bandwidth could indicate that the pilot is able to respond to higher frequency inputs which would be characteristic of a ‘rested’ pilot. Conversely, a smaller bandwidth would indicate the inability of the pilot to respond to high frequency inputs,which would be characteristic of a ‘tired’ pilot. Monitoring physiological variables such as electrical activity in the brain, pulse rate, and body temperature in association with fatigue has also been investigated. In one
study held by NASA’s Ames Research Center the scientists used an Oxford Medilog 9200 recorder to obtain data when pilots were asleep and while awake in an attempt to get a better understanding of what ‘tired’ looked like through physiological readings. Another recent study went a step further to incorporate a vigilance performance measure that used reaction time to assess sustained attention. This psychomotor vigilance task (PVT)14 is a ten minute reaction test that probes central nervous system capability. It has proved to be sensitive to the effects of sleep loss and circadian disruption 14 which could
imply the onset of fatigue. One disadvantage of this monitoring approach is that its implementation would require constant contact with the pilot which could potentially cause harmful interference with the pilot’s ability to carry out simple tasks or with other systems such as the action of the G-suit. Secondly, the measuring equipment would add unnecessary weight to the aircraft, which could increase fuel consumption.
a third downfall of these potentially bulky systems is that in most aircraft there just is not enough room in the cockpit for any extra instruments. In addition, these studies concluded that results had high variability among pilots 15.
As we can see from these studies there has been a significant interest in pilot fatigue detection and prevention. Even though methods such as ‘planned cockpit rest periods’ may have the potential to reduce the amount of fatigue-related accidents, there is no onboard system to monitor the pilot’s actual condition. Mathematical models can be
good for modeling but still no further research has investigated the model’s possible fatigue detecting qualities. And while physiological systems have been deemed potentially problematic, they still have been the only systems that would actually be able to give real-time analysis of the pilot.
Aircraft Controls
The purpose of this section is to provide a basic understanding of how the control system in an aircraft works.
Unlike an automobile that uses a steering wheel to rotate a set of tires for steering,control of an aircraft is achieved by producing aerodynamic moments about the three axes of the aircraft body coordinate system. The aircraft can be steered when air is deflected by the movement of control surfaces, particularly the ailerons, elevator, and
rudder. The yoke controls the ailerons and the elevator while the two foot pedals control the rudder
The ailerons are located at the ends of each wing and move opposite each other. For example, if the pilot pushes the yoke to the left the left aileron moves upward and the right aileron moves downward causing the aircraft to roll to the left. The opposite
happens when yoke is pushed to the right.
The elevators are on the horizontal tail of the aircraft. When the yoke is pulled backward the elevators move upward which causes the plane to go nose up. When the yoke is pushed forward the elevators move downward and this causes the plane to go nose down. This particular movement of the plane is known as pitch rudder is located on the vertical tail of the aircraft. When the pilot pushes in on the left foot pedal the right pedal moves toward the pilot causing the rudder to move to
the left. When the rudder moves to the left it will cause the tail of the plane to move to the right. The opposite action happens when the right pedal is pushed forward. This will cause the tail of the plane to move left. This motion of the plane is called yaw.
As these descriptions of an aircraft control system are very basic please refer to reference 16 for a more in-depth explanation.