Oil/Water Phantom
To demonstrate the fat suppression capabilities of the eZOOM sequence a water/oil phantom was used. A 50ml container (HDPE plastic) was filled with approximately 65% tap water and 30% canola oil (leaving about 5% air space) and placed upright into the MRI scanner (GE Signa 3T longbore). It was scanned in sagittal orientation to get a cross-section of both water and oil, as shown in figure 2.a (GRE localizer image). Using the eZOOM sequence with diffusion-weighting turned off, a circular area was imaged (shown by the yellow circle in figure 2), which is shown in figure 2.8.b. The water volume of the imaged area is clearly visible, while the fat portion is fully suppressed. A spin phase diagram is shown in figure 2a to illustrate the different spirotations for water and fat. To demonstrate that the pulse produces a 180 degree flip angle (refocusing) in water, but approximately 270 degree flip in fat (transverse excitation), the experiment was repeated with just a single 180 degree elliptical RF pulse applied and no other RF pulses or gradients prior to signal readout. It was expected that for water the magnetization Mz would simply be rotated to –Mz (inversion), producing no transverse magnetization and no signal, but for fat the magnetization Mz would be rotated to –Mxy, producing transverse magnetization and thus creating a fat-only image (comparable to a gradient echo sequence with spiral readout). Figure 2.12b illustrates the spin rotations for water and fat in this experiment. The result of this experiment is given in figure 2.c, showing no image from the water signal, but only from the oil portion. It should be noted that the distortions visible in the fat image are due to the absence of slice selection gradients (the eZOOM pulse excites a cylinder, effectively resulting in a projection image with improper phase summation along the z-axis orthogonal to the image), the local magnetic field distortions by the cap and oil/air interface of the container, and some oil stuck to the inside of the airspace (upper walls and cap).
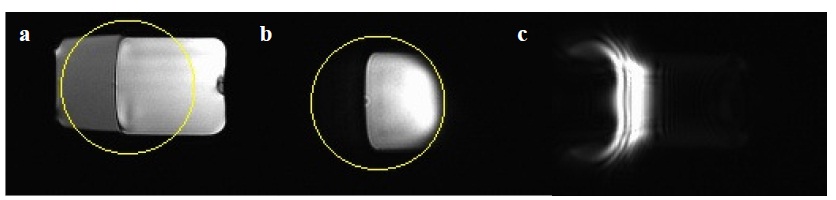
Figure 2 Oil/water phantom imaging experiment. Both water and fat signal are shown in the localizer image (a), only water signal is imaged in the eZOOM image (b) with the circular refocusing area pictured as the overlaid circle, and only the fat portion of the phantom is excited by application of a single 180 degree elliptical refocusing pulse (c).

Figure 3
Figure 3
Figure3 Generalized spin phase diagram for water (a) and fat (b) excitation as well as fat in the non-excited slice (c) in eZOOM. The abscissa is time and the ordinate is transverse spin phase relative to +Mx. The solid dark blue line is the most interesting phase path with the strongest echo signal contribution, the dashed blue line is the spin phase path that contributes to artifacts and needs to be suppressed by proper adjustment of crusher areas. Also shown is the magnetic gradient wave form in grey. RF1 in panel a and b (solid red line) excite both water and fat with 90˚ flip angle, while RF1 in panel c (dashed red line) is only shown for timing reference. RF2 and RF3 flip water with 180˚ and fat with 270˚. The MR echo signal for readout starting at TE is illustrated in green.
Figure 3 shows the primary signal paths that need to be accounted for when adjusting crusher pulses (illustrated in grey in the figure) in the eZOOM sequence. Spin phase diagrams are following the conventions used by Haacke et al. as earlier described by Kaiser et al. In the explanation below, nuclear spins are assumed to be aligned with the static magnetic field at +Mz for T<0. Spin phase is referring to the phase of the transverse magnetization of hydrogen proton spins relative to +Mx.For water excitation (panel a) the spin phase of the transverse magnetization in the excited slice behaves as expected in a twice-refocused spin-echo sequence; after two inversions by the 180˚ pulses it refocuses at TE for readout (primary spin path, dark blue line). The second path in panel a (dashed line) depicts the stimulated echo component arising from the 90˚ flip component of RF2 (due to imperfections in the pulse profile) flipping the transverse spin magnetization into –Mz where it remains until RF3 occurs. The 180˚ flip component of RF3 just flips magnetization back to +Mz (not shown), while its 90˚ flip component (again through imperfections of that pulse) produces a transverse magnetization component (dashed line continuing after RF3). The crushers before RF2 and after RF3 ensure that this path cannot refocus at TE (or anywhere during the readout window). For free water spins in the non-exited slices (by the RF1) there is no graphical illustration provided, since for this case magnetization of free water proton spins experiences a 180˚ flip (inversion) twice and ends up at approximately +Mz again at TE. For fat tissue in the excited image slice (panel b), the fat spins are excited just like water by RF1 (regular sinc excitation pulse), but they experience a 270˚ flip from RF2 and the spin phase is then stored in Mz, so the transverse magnetization phase remains unaffected by the crushers between RF2 and RF3 as well as other sources of transverse spin dephasing. This is similar to the stimulated echo path for free water. After RF3, the second 270˚ pulse, fat hydrogen spins are flipped into the transverse magnetization plane again and moved outside usable k-space by the crusher following RF3 where they do not contribute to the echo signal. However, there is a second phase path of interest (dashed line): Due to imperfections of RF2, there will be a small amount of spins experiencing a 180˚ flip. This portion will refocus, and is flipped into –Mz by RF3, where it does not contribute to the echo signal for readout. A third path that is not shown as its contribution is negligible for practical purposes is the one arising from a 180˚ component of RF3. This flips a small portion of the spins in the secondary path (dashed line) into the transverse plane where they refocus at TE and are responsible for a small signal from fat.Summarizing, because the main spin path (blue line) does not refocus in the readout window, and the secondary path (dashed line) flips fat excitation into -Mz, the sequence effectively suppresses fat signal as shown in the MRI image from figure 3.b. For fat tissue outside the excited image slice (panel c), the spin phase path cannot be ignored, as the eZOOM refocusing pulse is a cylindrical pulse and affects all locations within the cylinder (not just the excited slice). For fat tissue RF2 and RF3 act as 270˚ pulses, therefore (in absence of experiencing excitation by RF1) there is a large transverse magnetization component arising from RF2, which is tipped into –Mz after RF3 and does not contribute to the echo signal in the main spin phase path. The secondary phase path (dashed line) is more important: A portion of the spins will experience a 180˚ flip about RF3, and this signal will refocus at some later point in time. It is therefore important that the crushers around RF2 are large enough that the echo arising from this path does not refocus during the time window of signal readout. Note: If the magnetic gradient outside the excited slice is large enough to shift the resonance frequency of fat to that of water, those spins will experience the same 180˚ flip as water from the non-excited slices (flip from +Mz to –Mz at RF2 and back to +Mz at RF3) without contributing to the transverse MR signal.