
The Mercury/Tornado RF signal receiver
The received signal from a diffusion experiment has a wide dynamic range, with the diffusion weighted image having approximately 33% the signal of the un-weighted image when choosing a b-value that maximizes the DNR (S=exp(-b*D) with b*D=1.1 where the DNR curve reaches its maximum,). In practice, many tissue regions have a lower signal, as the diffusivity D varies widely across different types of tissue (white/gray matter and CSF). Additionally with high resolution imaging the available SNR drops 67 with the voxel size. In case of the desired resolution within this study that is about 4 times in one direction, SNR is about 16 times lower than with clinical diffusion imaging. Therefore, a solution was necessary to both increase the dynamic range of the typical 16bit A/D converters on clinical scanners and to improve achievable SNR. The high dynamic range direct sampling GC316 receiver developed by Mercury (now Tornado) and Andrzej Jesmanowicz at the Medical College of Wisconsin provides the necessary dynamic range and SNR for this project
Technical information
The receiver system consists of an ultra-low noise RF amplifier and direct conversion 16bit analog-digital converter (ADC) that samples the MRI signal near resonance frequency with downsampling done digitally by the Graychip GC4016, which is typically used in radar applications. A 100MHz MRI signal digitized to 16 bits downsampled to 250kHz becomes a signal of approximately 20 bit in dynamic range. This process is illustrated in figure 2, with figure 3 showing a block diagram of the receiver. Each N times decimation step will theoretically result in an dynamic range improvement by sqrt(N). The dynamic range improvement over base-band sampling at 250kHz is therefore 20. Compared to the 16 bit ADC at 500kHz (from the GE Signa EPIC Software Reference Manual, General Electric Medical Systems, 1998) of the GE Signa 3T Excite that is used in this study, the dynamic range improvement has a theoretical value of 3.8 bits.
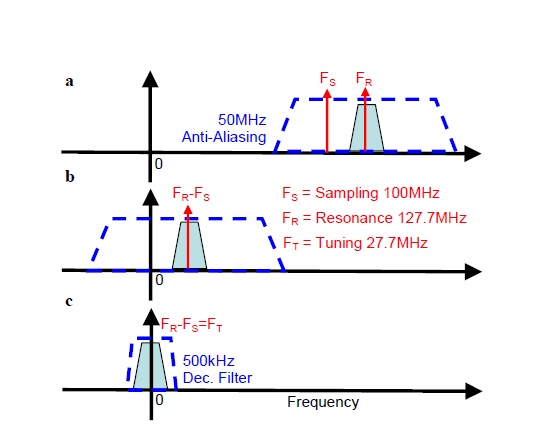
Figure 2 Illustration of the downsampling process using the GC4016 receiver chip.
The MR signal at resonance frequency FR is sampled and A/D converted at the sampling
frequency FS (panel a), resulting in an aliased signal near base band FR-FS (panel b). A
50MHz anti-aliasing filter ensures no frequency wrap-arounds. Mixing the signal
digitally with a intermediate frequency (the ‘tuning frequency’ FT) and a reference signal
shifts it into baseband (panel c). Several filter stages decimate the sample rate to the
desired base band frequency

Figure 3 Schematic of GC4016 chip down-converter stages.
The 16bit 100MHz signal is formatted to be mixed with the tuning frequency and
down-sampled in several stages, separately for real and imaginary part of the RF signal.
The result is stored as 24bit data values at baseband (250kHz or 500kHz typically).