The Jupyter notebook is a great friend of the data scientist. It allows the user to write code and create visualizations of data all in the same tab on their browser. It is included in the standard distribution of Anaconda, and can be launched from the command line (note, not inside Python, but in the terminal window) by entering jupyter notebook. On the upper right side, select New, and then select Python. This will open a new notebook.
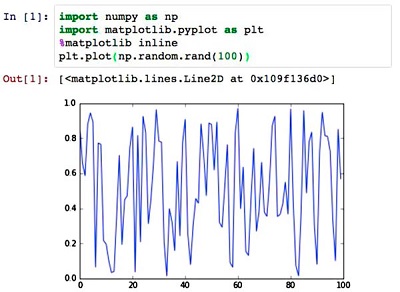
The matplotlib inline feature uses the magic operator %. This particular magic operator prints graphs directly in the notebook. This is perhaps the most friendly feature to any scientist: code followed by visualization, in one neat notebook.
This allows for effective notebooks to be extremely shareable. Note that to execute a block of code you can type shift+enter.
One advantage to Jupyter is its built-in help function. To see the documentation for a particular function, try, e.g.:
>>> import numpy
>>> help(numpy.random.randint)
Help on built-in function randint: