Difference Between Solar And Wind Energy
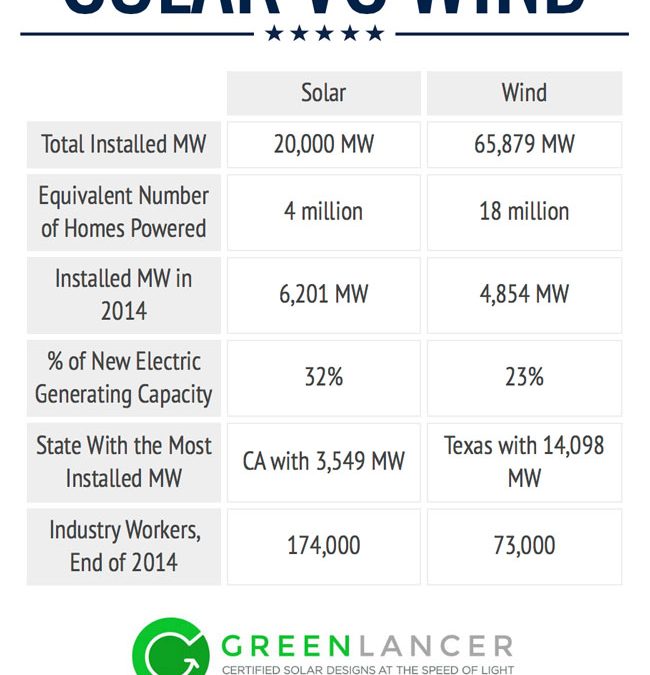
Solar and wind energy have some common features. Both of them are considered renewable energy, both of them are stochastic, and some energy forecast methods work for both of them. Since this research is focusing on solar power, it is important to understand the difference between solar power and wind power. There are two kinds of differences; there is a physical difference, and there is a market policy difference between them.
Physical
Physically, both solar and wind power are stochastic, but wind power can peak at any time day or night, while solar power peaks during the day. Wind power uncertainty is more related to air pressure change and sudden wind speed change. Although solar power it is only during daytime, it is stochastic as weather condition, and cloud movement
highly affects its production. Also, high temperature and humidity reduces PV panel’s efficiency. Dust accumulation on PV panels can cause no power production at all. In terms of predictability, many of the same prediction methods are used for both solar and wind power. Prediction methods are valued for their accuracy, which is the error between actual measurement and predicted value. In order to evaluate the accuracy of prediction, there are two popular bench marking methods that are used in literature, they are :
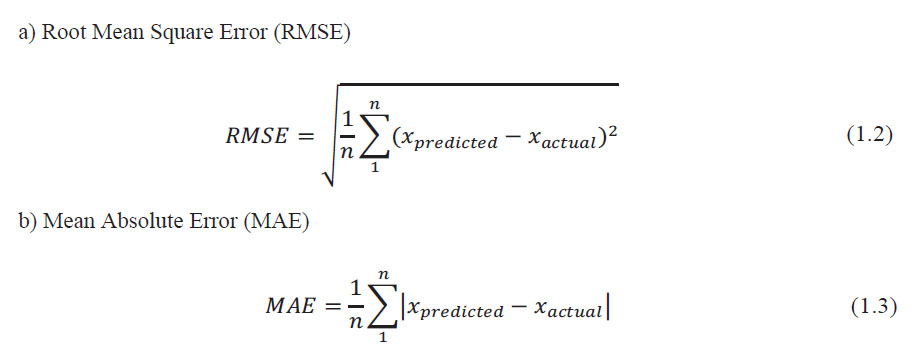
In literature, it can be observed that sometimes the RMSE value between prediction forecast and actual power production of renewable plants can differ by a significant amount. This difference is because some are forecasting the power produced in a single plant, and some are aggregating the forecast for a “control area” which combines forecasting different plants together. It is expected that RMSE value for a control area will be less than a single plant as having a large deviation in the entire area suddenly is rare. For example, if a cloud passes on top of PV plant then this plant’s generated power will decrease, but the same cloud will not be over other plants at the same time, so the total RMSE of all these plants together will be less than this single plant. In this research the focus will be on a single plant production forecast as each plant is expected to participate in the electricity market individually. One important factor is the effects on the RMSE value of the forecast horizon time. As the forecast horizon gets further away, the RMSE gets higher.
Table 1 and Table 2 have the average RMSE values for solar and wind forecasting from different papers. It can be observed that in wind forecasting the RMSE value between hour ahead (HA) and DA usually is not large, while for solar power it varies by location. Also, it can be observed that the RMSE value for DA in solar is higher than 30% in most of the papers while for the wind it is on average around 20%. Although it might be thought that solar would be more predictable, these tables showed that wind power is the one more predictable. That is another good reason that this research will focus solar
power.

Table 1 Solar RMSE value from different papers
Table .2 Wind RMSE value from different papers
Since this work focuses on the Saudi Arabia electricity market, it is important to consider the condition of the weather in Saudi Arabia. The weather in Saudi Arabia is harsh, especially during summer. With high humidity, water vapor accumulates on the PV cells, in addition to lots of dust in the air. All can mix and form a layer that sticks on the PV cell, causing a reduction in energy production . From a field visit to an experimental field in the Half Moon bay in Dhahran, Saudi Arabia, PV cells have to be cleaned regularly, cells that are left without cleaning will not produce any power . The RMSE values observed in Table 1 are mostly in non-tropical environments. It is expected that PVs in Saudi Arabia will have higher RMSE values as dust accumulation is also unpredicted.
Market Policies Related to Solar and Wind Energy
Each market has its own policy to deal with renewables. Some treat solar and wind energy the same way and others treat them differently. It can be observed that most markets have almost similar policies regarding dealing with Solar and Wind energy. These small differences will be discussed in this section and can easily be identified in Table 3. In PJM, solar plants are currently treated as a negative load. Simply they do not have to participate in the DA market as they get paid the real time market price for production. In PJM every wind farm has to participate in DA with its “capacity resource” based on PJM’s capacity factor. The capacity factor is “the ratio of the total energy generated by a generating unit for a specified period to the maximum possible energy it could have generated if operated at the maximum capacity rating for the same specified period, expressed as a percent”. Note that this is different than efficiency. PJM’s wind capacity factor is currently set at 13%, but if a plant’s wind data showed that it could not meet this value at a certain time then it is not obligated to participate in the DA market for that specific time In the California ISO (CAISO), it is voluntary for both wind and solar plants to participate in the DA market, but they are penalized if they deviate in RT. If they do not participate in the market, then they will just simply get RT market price . The mechanism to participate in the market (either through an aggregator or through a scheduling coordinator) will depend on the capacity of the renewable plant .In the New York ISO (NYISO), both wind and solar power plants are exempted fromimbalance penalties between DA and RT up to 3,300 MWh/ plant .In ERCOT, the wind farms and solar plants do not have to participate in the DA market . If wind generates 10% more than its DA obligation, it will be charged a penalty based on RT price . Renewables in ERCOT get a state credit (including solar and wind). in the UK, a Feed-in-Tariff (FiT) is used for both wind and solar plants. They do not participate in the electricity market and simply receive a fixed price for every MWh . In Denmark, offshore wind farms get a fixed payment (FiT), onshore wind farms and solar plants can bid in the market and will get the market price plus a price premium In Spain, all renewables have the option either to get a FiT or market price with premium. FiT rate depends on the renewable type . In Germany, solar power plants get a FiT but the rate depends on whether the PV was rooftop or not, and it depends on the MW-p (Mega Watt Peak) of the PV . For wind farms, the onshore FiT rate is different from offshore FiT rate .
Table 3 Market policy wind vs solar From Table 3, it is clear that there are many similarities in policy between the wind and solar power. There are still few differences for example PJM treats solar as a negative load. Some FiT rates are different depending on which renewable technology is used. Also, most of US markets make it optional for renewables to participate, but as discussed in an earlier section, this is considered as an incentive that will be reduced or removed in the near future. Currently, subsidies are causing some markets to have negative prices as some renewables are bidding negative price in order to get the subsidy. Such a practice distorts the market and sends wrong signals.
https://digital.lib.washington.edu/researchworks/handle/1773/38615