introduction
There is a lot of excitement and zeal when it comes to the topic of stock prediction; a lot of communities like business, linguistics, sciences, engineering, etc. do the research on stock prediction, and in a many different ways . Conventionally stock prediction was done in more of a visual way or on paper and things were pretty slow. Since computers the ease and speed of computation has increased monumentally. To keep up with the market, the research has to be exceptionally innovative and should “leave no stone unturned”-Euripides. There are mainly two types of trading approaches, Fundamental and Technical. Fundamentalist trade stocks based on the company’s news like earning announcement, acquisitions, analyst’s recommendation, etc. On the other side the technicians’ deal with charts and graphs and techniques like Fibonacci retracements tools etc.
Background and Problem Statement
The main motive behind this thesis is to predict the long-term stock market movement, to find out patterns in technical indicators, analyze the sentimental value of a piece of text and find its correlation with the market prices. Financial markets are very huge and all the financial markets around the globe are interconnected in some way or the other, so for an investor it is very difficult to understand the whole market or to read each and every piece of text. So automated systems have the capability to outperform humans, and more and more research suggests the same. These automated systems make use of a lot of things like historical prices, textual data, volume of shares traded and probably some more complex mathematical concepts, which only certain experts understand.. A lot of previous study indicates that more and more research is shifting towards high frequency trading; investors do not want to miss even a second, it is more about seconds and minutes, which previously was about weeks and days. Most of the information generated these days is by common people, which can come up on websites like Twitter, Facebook or even comments posted on various websites. This information forms the basis of many high frequency 3 trading systems. There are some things, which either textual data or technical indicators cannot do. For example, the 2008 crisis or any other major crisis that hits any economy or economies, it is almost impossible to predict solely based on technical indicators, because such events are very rare.
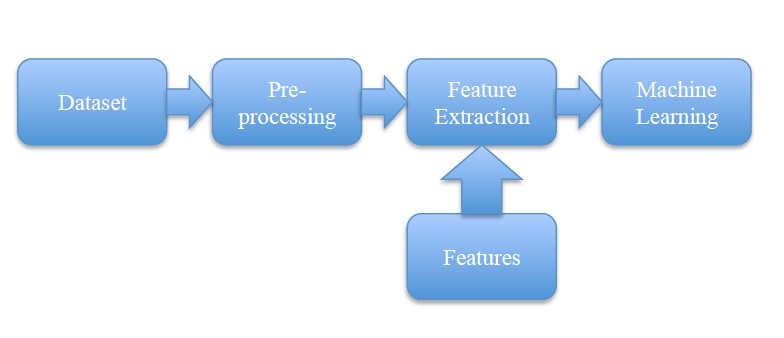
Figure 1: General Stock Prediction System
The system to be developed in this thesis must take the above things into consideration; it should have a dataset that will span over many factors that influence the stock market. Pre processing should be done in order to remove noise from the data, most of the datasets are not in pure form and some or the other kind of pre-processing has to be done in order to make it usable. The textual features should get the most out of the dataset and thus should ideally be compiled by an expert on linguistics and business. The machine learning technique should be highly accurate and time efficient.
Standard & Poor’s 500
The Standard & Poor’s or commonly known as S&P 500 is an index of roughly 500 stocks from the U.S market, the S&P index Committee decides the companies to be included in the index, the S&P 500 is regarded as the best indicator of the U.S. economy. The companies are chosen from some major sectors like Financials, Information Technology, Energy, Telecommunications Services, etc. , most of the companies are large cap and a few mid-cap. The S&P 500 was started in 1923 and it comprised of 233 companies. By 1957 computers were introduced and the count became 416 and S&P became S&P 500 . There are various factors on which the inclusion to the S&P 500 list depends like sufficient liquidity, ownership not resting in a few hands, profitability and must be a significant part of an industry. The S&P list keeps changing mainly due to deletions which can happen due to various reasons like bankruptcies, mergers etc.
8-K’s
Whenever a company is publicly listed, the public has all the right to know what goes inside the company. It is mandatory for publicly listed U.S. companies to file 8-K, within four business days whenever there is a significant business event.
For example:
• “Entry or exit from a material definitive agreement.”
• “Departure or arrival of directors.”
• “Change in shell company status.”
• “Change of servicer or trustee.”
• “Amendment of company’s code of ethics, or waiver of a provision of the code of ethics.”
• “Temporary suspension of trading under the company’s employee benefit plans.”
• “Modifications to shareholder rights.”
• “SEC investigations and internal reviews.”
• “Changes in executive management.”
• “Change in control of company.”
https://books.google.com/books/about/Developing_an_Automated_Stock_Recommenda.html?id=j8BKAQAACAAJ
