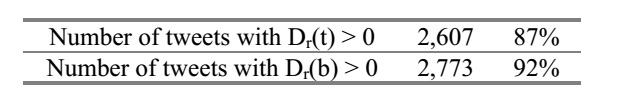
In order to establish a baseline or sentiment score calculations for the tweets, a control group of 3,000 tweets was randomly selected out of the collection of 81,158 tweets that had a distance greater than 0 between the two sentiment scores calculated. The tweets were presented in their original form as collected from Twitter with Twitter Streaming API, and without including any sentiment scores. Each tweet was assigned a single sentiment score. The results were collected and compared with the scoring results as calculated by the programmatic component described in Chapter 3: Sentiment Analysis section. Let R(t) be the sentiment score for a tweet t assigned by a rater. Then Dr(t) which is the distance between R(t) and S(t) defined as Dr(t) = R(t) – S(t) and Dr(b) which is the distance between R(t) and S(b) defined as Dr(b) = R(t) – S(b). For 2607 tweets out of the 3,000 random tweets selected for human scoring, there were Dr(t) > 0 and for 2,773 tweets out of the 3,000 random tweets selected for human raters there were Dr(b) > 0. Table 3 summarizes the counts and percentage of tweets where distance between the scores was greater than 0.
Summary of Scoring Comparisons Control Group vs. Machine Scoring:
Machine Scoring
Figure 11 illustrates the differentiation of Dr(b) and Dr(t) for the control group of tweets where the gray line corresponds to Dr(b) and black line is representing Dr(t)
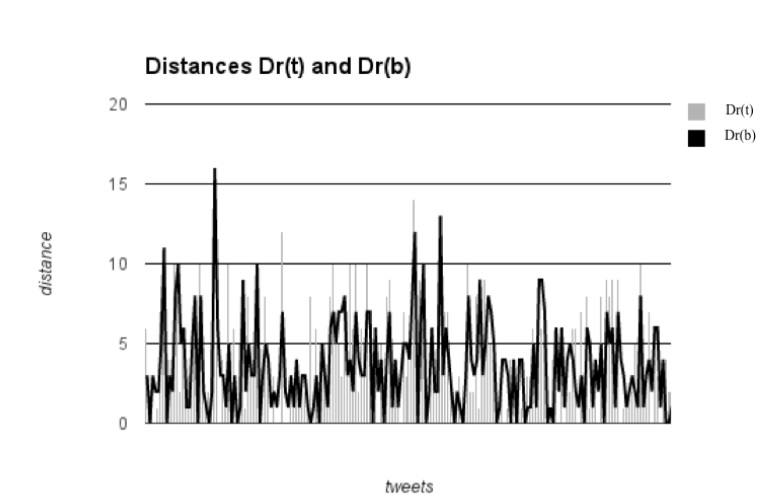
Figure 11. Distances Dr(t) and Dr(b) Table 4 presents the mean, variance and standard deviation values for the distances Dr(b) and Dr(t). Table 4. Mean Values, Standard Deviation, and Variance of Scoring Distances

While variance and standard deviation are the same for both distances, the mean distance pointed in favor of the sentiment score calculations with a hashtag over the sentiment score of the body only. However, more interesting information could be gleaned by examining the mean squared error (MSE) and root-mean-square error (RMSE) values for the three vectors of sentiment scores – Vu (the vector of human rated sentiment scores), Vb (the vector of sentiment scores based on the body of tweet only) and Vt (the vector of sentiment scores of the total tweet, with hashtags). MSE is used to quantify the difference or distance between the observed values and their corresponding estimated values. RMSE is a measure of a distance between the predicted values and the observed values. In our case, the observed values were Vu, which were used as a baseline for sentiment score calculations as an industry-standard approach, while Vb and Vt represented different estimating models. Table 5 presents the MSE and RMSE values for Vb and Vt.
MSE and RMSE Values for the Two Scoring Models
the Two Scoring Models
This data suggested that sentiment scores calculated with the inclusion of hashtags were closer to the user rated sentiment scores than the sentiment scores that were based on the body of tweets only. Additionally, the difference between Dr(b) and Dr(t) (i.e., the distances between the vector of human scores Vu and the vector of sentiment scores
without the hashtags Vb and the vector of human scores Vu and the vector of sentiment scores with the hashtags Vt) was significant (t(2,999)=3.7035, p =0.0001083). Moreover, the correlation between Vu and Vb was 0.239, while the correlation between Vu and Vt was 0.47347. Sentiment scores incorporating hashtags correlated better with human ratings. The effect of the inclusion of hashtags in sentiment score calculations was much larger for those tweets that had S(b) = 0. Of the 3,000 tweets in the control group, there were 1,661 tweets that had S(b) = 0 and S(t) ≠ S(b). In 1,324 (79.7%) of those, the human rated score R(t) agreed in their polarity with the combined sentiment score S(t). Furthermore, there were 202 tweets that had opposing polarities for S(t) and S(b). Of those, for 119 tweets (58.9%) user score R(t) agreed in polarity with S(t). Upon examination of this subset, the common aspect of those tweets was the fact that the users used hashtags to completely reverse the sentimental value of the tweet, whether by the implicit or explicit mention of sarcasm as a part of hashtags attached to the tweets such as “#sarcasm” or “#NOT.” Users have been demonstrated to utilize hashtags in a variety of ways. Some of the uses had a direct bearing on the sentiment of the tweet such as dampening or strengthening the sentiment of the tweet. Additionally, users have been demonstrated to use hashtags in order to completely reverse the polarity of the tweet sentiment. Incorporating raw hashtag values with no restrictions in analyzing tweets for their sentiment can contribute a significant value and allow for further refinement of the results. Ignoring it, or severely restricting allowed values when calculating sentiment. analysis, can be counterproductive and can cause an exclusion of a significant layer of semantic compositionality that is embedded in the tweets.
Conclusions
There was a significant variation between the sentiment scores of the tweets when comparing tweet body only with tweet body and hashtags combined. The variation was expressed as either dampening or intensifying the original sentiment score calculated without the hashtags. The results in this study were indicative of hashtags being employed by users as a reversal, enhancement, or dampening of their emotional tone when combined with the tweet body. It appeared that hashtags were too valuable of a tool for sentiment analysis purposes to be either completely ignored or severely limited in their expressive powers. Statistical analysis supported the incorporation of hashtags in the sentiment score calculations in order to achieve a better prediction of the sentiment scores assigned by users. The 79.7% success rate on predicting the polarity of the tweets, as demonstrated in this study, could significantly increase the overall success rate in cases where a traditional approach produced a sentiment score of 0. Additionally, the results of this study demonstrated that the difference between the distances of human scoring vs. machine produced scoring with and without hashtags was significant and that the sentiment scores calculated with the hashtags were better correlated with observed values than scores calculated without the hashtags. This was a preliminary study into the feasibility and utility of a broad hashtag inclusion in all their variety into sentiment score calculations, and as a result some promising directions for future research have emerged.
Directions for future research
There are several directions for future research of the sentiment analysis of hashtag values. First and foremost of those is repeating this study with trained human raters to provide the sentiment rating for the random control group. This will also allow examining the relative weight of a hashtag contribution to the sentiment score of the tweet in cases where there is a polarity reversal between the body and the total tweet or when the body of the tweet is not carrying any sentiment. The awareness and identification of sarcasm and irony are extremely important in sentiment analysis application, since the inability to do so can result in a complete reversal of the sentiment polarity and misclassification. Due to the restrictive nature of microblogging such identification should be based on the “bag-of-words” analysis and could be based on the polarity reversal or other markers. The ability to identify those and other associated features of sarcasm, irony, and humor in general as well as other emotional characteristics of tweets and its incorporation into sentiment analysis of microblogs could be very productive. In order to create an ANEW-like dictionary for hashtags, it would be beneficial to have human raters rate tweets with and without the hashtags. Multiple users could rate each tweet such that the fundamental sentiment scores of the hashtags could be established. The complicating factor in this case is the loose structure and potentially rapid decay of popular and most used hashtags. Additionally, a survey on longevity of hashtags could be beneficial – while some hashtags relate to current events, others are less time-constrained in their sentiment carrying ability. Investigating what types of tweets produce the most disagreements between machine and human scoring, be it a specific polarity or any other feature of the tweet, could prove to be valuable to the sentiment analysis. Identifying distinct attributes of tweets that cause a heavy skewing in the sentiment score could allow adjustments to be made for correcting those distortions. Combining hashtags with a dictionary of emoticons that are most often associated with each other could reveal an additional layer of sentiment that could be productively employed in an attempt to assign a sentiment score to hashtags. Those are but a few possible venues for future research. The abundance of available data and the ever increasing popularity of microblogging and Twitter allow for multiple new approaches to be implemented and examined.