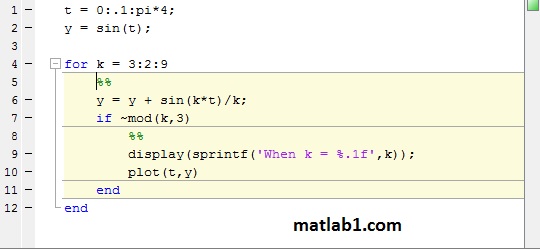
With simple code file scripts, one can break the code into sections called code cells. With code cells, you can run one cell at a time and you can also publish the code in an HTML format with plots embedded and with formatted equations.
To break code into cells, create comment lines that begin with two % symbols; these become the cell titles. For example, the following script that plots sin and cos has been modified to have two cells: one that creates vectors for sin(x) and cos(x) and plots them; and a second that adds a legend, title, and axis labels to the plot.
% This script plots sin (x) and cos (x) in the same Figure
% Window for values of x ranging from O to 2pi
%% Create vectors and plot
elf
x = 0: 2*pi/40: 2*pi;
y = sin(x);
plot(x,y, 'ro ' )
hold on
y =cos (x);
plot(x,y, 'b+' )
%% Add legends, axis labels, and title
legend ('sin' , 'cos' )
xlabel('x')
ylabel ( 'sin (x) or cos (x) ' )
title ('sin and cos on one graph')
When viewing this script in the Editor, the individual cells can be chosen by clicking the mouse anywhere within the cell. This will highlight the cell with a background color. Then from the Editor tab, you can choose “Run Section” to run just that one code cell and remain within that cell, or you can choose “Run and Advance” to run that code cell and then advance to the next.
By choosing the “Publish” tab and then “Publish,” the code is published by default in HTML document. For the plotlptCells script, this creates a document in which there is a table of contents (consisting of the two cell titles), the first code block which plots, followed by the actual plot, and then the second code block that annotates the Figure Window, followed by the modified plot.


