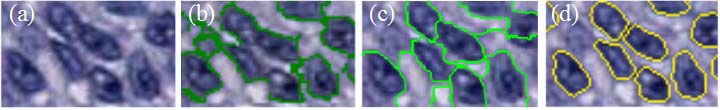
Figure 1. Segmentation results on three methods on arbitrarily choosen patch. From left to right: a. Original image, b. Otsu, c. ISO, d. Minimum-model.
The local features (holistic features) consist of texture and cell level information, i.e. appearance and shape of every individual cell [13]. Haralick features [11] and Gabor wavelet texture [14] are calculated to measure the texture of the cells. In order to get the accurate cell-level information, there is a need for accurate and effective cell detection and segmentation method which extracts the cell nuclei [13]. A contour based minimum model approach for detection and segmentation of cells from microscopic images is adopted. This approach is motivated by [15].
The approach, detects contours which are not dependent on its shape, by using minimal priori information [15]. The segmentation bias is avoided with reference to the shape features and enables precise cell segmentation. The results of the segmentation of a patch which is randomly selected is shown below in Figure 1, comparing the minimum model approach with Otsu [16] and ISO (Isoperimetric) method [17].
The results clearly indicate the accuracy of minimum model as it can precisely detect robust boundaries of individual cells. The geometry and textural features are extracted from the cells based on the segmented boundaries of cells. The geometry properties consist of area, compactness, eccentricity, twelve other similar properties, and also Zernike shape features [13]. The texture features are then extracted from each cell. A cell which has a smooth appearance usually has not many textures. If a cell has many textures, then it appears rough and exhibit a varied pixel intensities. The Haralick [11] and Gabor ”wavelet” features [14] are measures as texture properties of objects [13].
[11] R. M. Haralick, K. Shanmugam, and I. H. Dinstein, “Textural features for image classification,” IEEE Transactions on Systems, Man and Cybernetics, no. 6, pp. 610–621, 1973.
[12] A. N. Basavanhally, S. Ganesan, S. Agner, J. P. Monaco, M. D. Feldman, J. E. Tomaszewski, G. Bhanot, and A. Madabhushi, “Computerized imagebased detection and grading of lymphocytic infiltration in her2+ breast cancer histopathology,” IEEE Transactions on Biomedical Engineering, vol. 57, no. 3, pp. 642–653, 2010.
[13] J. Yao, D. Ganti, X. Luo, G. Xiao, Y. Xie, S. Yan, and J. Huang, “Computer-assisted diagnosis of lung cancer using quantitative topology
features,” in Machine Learning in Medical Imaging, ser. Lecture Notes in Computer Science, L. Zhou, L. Wang, Q. Wang, and Y. Shi, Eds. Springer International Publishing, 2015, vol. 9352, pp. 288–295. [Online]. Available: http://dx.doi.org/10.1007/978-3-319-24888-2 35
[14] D. Gabor, “Theory of communication. part 1: The analysis of information,” Journal of the Institution of Electrical Engineers-Part III: Radio and Communication Engineering, vol. 93, no. 26, pp. 429–441, 1946.
[15] S. Wienert, D. Heim, K. Saeger, A. Stenzinger, M. Beil, P. Hufnagl, M. Dietel, C. Denkert, and F. Klauschen, “Detection and segmentation of cell nuclei in virtual microscopy images: a minimum-model approach,” Scientific reports, vol. 2, 2012.
[16] N. Otsu, “A threshold selection method from gray-level histograms,” IEEE Transactions on Systems, Man and Cybernetics, vol. 9, no. 1, pp. 62–66, Jan 1979.
[17] L. Grady and E. L. Schwartz, “Isoperimetric graph partitioning for image segmentation,” IEEE transactions on pattern analysis and machine intelligence, vol. 28, no. 3, pp. 469–475, 2006.