Introduction
The KITTI Vision Benchmark Suite is a repository of real-world data for autonomous driving created by Karlsruhe Institute of Technology and Toyota Technological Institute at Chicago [1]. The series of datasets in KITTI is widely used for research because the KITTI Suite provides detailed documentation of data collection process, data format, and benchmark rules. The suite prepared different datasets from the raw data for a variety of tasks including stereo matching, optical flow, visual odometry / SLAM and object detection [1].
Collection
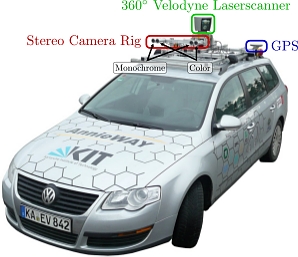
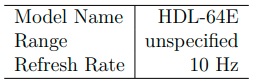
The raw data of KITTI was collected by driving a Volkswagen Passat B6 equipped with various types of sensors in urban, suburban, and rural settings. The annotated setup of the car is shown in Figure 3.1. The LIDAR installed on the car is a Velodyne HDL-64E whose model is described in detail in Table 2.1. For those LIDAR parameters that allow custom setups, KITTI’s choices are listed in Table 3.1.
Table 3.1: Parameters of LIDAR used on KITTI’s data collection car [5].

Annotated diagram of the fully-equipped car used for collecting KITTI
Format
The raw data is formatted differently for different tasks. Here, we only discuss the format of the dataset used for 3D object detection. The dataset consists of images, calibration parameters, labels, and point cloud, all indexed from 0 and padded to six digits, e.g. 000000.txt.
The images and point clouds are saved as PNG files and BIN files respectively. The images are taken by the left color camera (Cam 2 in Figure 3.1). The calibration parameters and labels are saved as text files.
The calibration parameters include image rectification matrices and transformation matrices between different coordinate systems of cameras and the LIDAR. The terms used in the calibration files to name these matrices are P0, P1, P2, P3, R0_rect, Tr_velo_to_cam and Tr_imu_to_velo. P_X projects camera coordinates to the image pixel space. The R0_rect matrix is for image rectification. Tr_velo_to_cam transforms the LIDAR coordinates to camera coordinates. Tr_imu_to_velo transforms the coordinates of the inertial measurement unit (imu) to LIDAR coordinates. An example of how to use the matrices is given in [1]. Equation (3.1) transforms a point in the LIDAR space to the image captured by Cam2. The matrices are all row major and may require extension before using.
![]()
The label files contain the ground truth. Only the objects in the view of the camera are recorded. The information is saved as a string of values separated by spaces.
The order is type, truncation, occlusion, alpha, bounding box, dimension, location, and rotation. There are a total pf 14 columns in each entry of an object. Type denotes the type of object, which could be one of ’Car’, ’Van’, ’Truck’, ’Pedestrian’, ’Person sitting’, ’Cyclist’, ’Tram’, ’Misc’ and ’DontCare’. The naming is straightforward in general. The ’DontCare’ means the object is present but not valid for detection because of occlusion or truncation. Truncation is a single float value that denotes the percentage of the object leaving image boundaries. Occlusion could be 0, 1, 2 or 3. Larger means more occluded. Alpha is the observation angle represented by a single float number ranged from −π to π. Bounding box is the box that fully contains the object inside. This term consists of four float values that are the left, top, right and bottom pixel coordinates respectively. The dimension term has three float values in the order of height, width and length, all in meters. The location term includes the coordinates in camera coordinates, which has three values. The rotation term is the angle that the object rotates around the y axis in camera coordinates, often referred as ’rotation y’. The coordinate systems of sensors can be found in Figure 1. It is important to note the difference between the coordinate systems of camera and LIDAR.
Evaluation
KITTI provides a set of rules for evaluating object detection performance. The organization also maintains a leaderboard for researchers to compare. To learn the evaluation process of the 3D object detection task, we first understand what an object is like in the 3D space. In Figure 2, a car and its surroundings in point cloud are shown. Because it is not realistic to process the irregular shape of cars directly, the actual representation of a car is the bounding box. When detection is performed, the output should be a bounding box as well.
The first step of evaluation is to tell whether a predicted bounding box is correct. The popular method used by KITTI is to compare the percentage of overlapping with an arbitrarily set threshold. The threshold used by KITTI is 70%. The formal term for overlapping here is intersection over union or IOU. This is a commonly used metric defined as:
where Bgt is the bounding box of ground truth and Bp is the predicted bounding box. In the context of 3D object detection, Bgt and Bp are volumes. A potential problem of this method is that after the cutoff at the threshold, the information about the accuracy of the predicted car location is lost. For example, an object detection algorithm could consistently yield slightly smaller bounding boxes and satisfy the minimum IOU for a superior result, while in reality, this would increase the risk of collisions.
KITTI divides the dataset into three difficulty levels. The criteria used are height of bounding box, occlusion and truncation. The definitions of the difficulty levels are shown in Table 3.
What a car looks like in point cloud with its bounding box
Definitions of difficulty levels of KITTI’s 3D object detection task
In object detection, the class of the detected is called positive and otherwise is called negative. The predicted result can be true or false. Therefore, a detection result can be classified into one of the four categories: true positive (TP), true negative (TN), false positive (FP) or false negative (FN). The metric used to evaluate the performance of detection is called precision-recall curve, often abbreviated as p/r curve. Precision is defined as:
Precision formula
and recall is defined as:
recall formula
Most methods for object detection do not directly output a binary result. Instead, the output is often a confidence score or a likelihood value. While the 70% threshold set for IOU tells whether a detection is true or false, we need to also set a threshold for the confidence score to distinguish positive and negative. Tuning the threshold value is similar to tuning the sensitivity in traditional applications of detection. Mathematically, this process can be defined as:
where x, T and y are respectively the confidence score, the threshold, and the final result. As we tune the threshold for the confidence score, recall and precision change in opposite directions. Therefore, the p/r curve is useful for displaying at specific precision levels how good the recalls are. Generally, the higher the curve in the graph, the better it is. However, sometimes it is not easy to rank p/r curves. The two p/r curves in Figure 3 intersect twice. The intersections divide the graph into three regions. Without an arbitrary choice of a desired recall or precision value, it is not obvious which curve represents better performance.
To make performance ranking easier, a metric named average precision (AP) is calculated from the p/r curve. The definition of AP is the area under the p/r curve which is mathematically defined as:
where r is the recall and p() is the function that maps recall to the corresponding precision. Because the data behind the p/r curve is discrete, we do a Riemann sum as shown in the equation to approximate the integral. N is the total number of data points.
KITTI chose to first sample 40 data points and then use the 40 points to calculate AP.
[1] A. Geiger, P. Lenz, and R. Urtasun, “Are we ready for autonomous driving? the kitti vision benchmark suite,” in Conference on Computer Vision and Pattern Recognition (CVPR), 2012.