Tactile Imaging System
Tactile Sensing
Human have five senses: smell, taste, sight, hearing and touch. The touch sense is also called tactile sensation. It is recognized by the receptors of touch which are found mainly in the skin. Since Hippocrates, the human sense of touch has been the most prevalent and successful medical diagnostic technique. A great variety of diseases were diagnosed through tactile sensing including detection of malignant tumors (Sarvazyan et al., 2011). Since the tumors are usually associated with changes in mechanical properties, such as the tumor tissues tend to be stiffer than the healthy tissues, doctors often used palpation to detect breast tumors (Krouskop 1998). In clinical practice, they often used the hand and the palm to assess the mechanical properties of tissues for diagnosing. Although this is a useful method of diagnosis, doctors often miss nodules and small lumps (Barman & Guha, 2006). The issue of improving the qualitative nature of palpation characterization has received considerable attention in recent periods, as indicated by Hall et al (Cited in Tiwana et al., 2012).
Many artificial tactile sensors have been developed over the past decade (Schmidt et al., 2006). The capacitive sensors, transforms the applied force into capacitance variation (Chu et al., 1996), (Leineweber et al., 2000), (Morimura et al., 2000). The capacitive sensors are able to show spatial resolution, but they have significant hysteresis and are very sensitive to temperature (Dargahi et al., 2000). The piezoresistive sensors monitor the resistance change in a conductive material under the applied force (Samaun et al., 1973). This type of sensors have high sensitivity and low cost, but they consume a lot of power and cannot measure multi-touch at the same time.(Kolesar and Dyson, 1995), (Schaffner et al., 1991). The piezoelectric sensors use the piezoelectric effect, which is the voltage generation across a piezoelectric material when the force is applied (Rossi and Domenici, 1986). This type of sensor is simple and inexpensive. However, they have limited spatial resolution and hysteresis (Krishna and Rajanna, 2004). The magnetic-based sensors measure the movement of a small magnet by an applied force generating flux density (Ong et al., 2009). The advantages of this type of sensors are high sensitivity, good dynamic rage and linear response. But they can only be used in non-magnetic object.
General architecture of these devices has several common features and components, such as a probe with an array of tactile sensors, an electronic unit, and a touch screen laptop computer (Egorov & Sarvazyan 2008). The configuration of the probe, structure of sensors, user interface, and data processing algorithms are specific for a particular application. Figure 1 shows general view of the devices for breast tumor detection (Medical Tactile, CA). This device includes three parts: a sensor probe, an electronic unit and a computer. The probe for the tactile breast imager (TBI) has 192 pressure sensor and array of 40mm by 30mm to acquire pressure patterns between the probe surface and the skin surface of the breast during contact (Figure1). Each pressure sensor has rectangular pressure sensing area of 2.5mm by 2.0mm (PPS, CA). TBI can quantitatively evaluate multiple mechanical and structural properties of breast and breast lesions, such as Young’s modulus, elasticity contrast, tissue nonlinearity (strain hardening), heterogeneity index, nodule size, shape and mobility, which could be altered by cancer development (Sarvazyan et al., 2011).
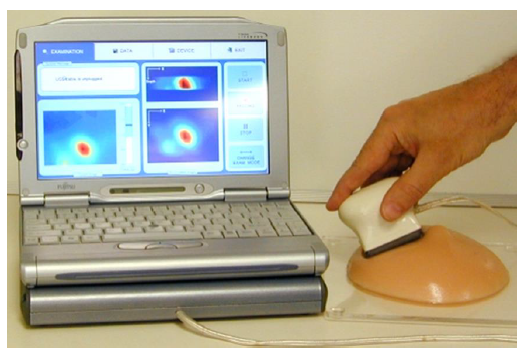
Figure 1: General View of the TBI (Reproduced from Egorov, V. and Sarvazyan, A.P., IEEE Trans. Med. Imaging, 27, 1275, 2008.)
First Generation Tactile Imaging System
The optical sensor is also commonly used in artificial tactile sensors. This type of sensor uses the optical tactile sensing mechanism called “phenomenon of photoelasticity” (Katz, 2002), which means if pressure is applied to the photoelastic sensing probe of optical sensors while light is injected into it, light intensity changes and the changes can be measured. An optical sensor project called the Tactile Imaging System (TIS) from the Control, Sensor, Network, and Perception Laboratory at Temple University was designed to detect breast tumor. In this thesis, we call it First Generation Tactile Imaging System (TIS G1).
TIS G1 is based on the total internal reflection (TIR). Total internal reflection is a phenomenon that happens when light injects from a high refractive index medium (n1) into a lower refractive index medium (n2), and when its angle of incidence () is greater than the critical angle (
 ), the light cannot pass through and it is entirely reflected, where . Under the TIR conditions, light completely reflect back into the high index medium (Ramachandran et al., 2013). Figure 2 displays the three major angles related to total internal reflection.
Figure 2: Optical Reflection: Critical Angle and Total Internal Reflection (Josell7, 2012)
In this case, a flexible transparent waveguide made of Polydimethylsiloxane (PDMS, Si(CH3)2) , which is a high performance silicone elastomer, is used as the sensing probe (Rajan et al., 2003) (Chang-Yen et al., 2005). The refractive index of the PDMS waveguide is greater than the air, so when the light inject into the waveguide and the angle of light exceeds the critical angle, the light will be trapped inside of the waveguide. The principle of this device is based on the observation the changing of the reflected light, which is caused by pressure from the object (Lee and Won 2011). Figure 3 shows the conceptual diagram of tactile imaging system. From the diagram, we can see if no pressure was applied on the waveguide, there was no image appears on the screen. When the pressure was applied on the waveguide, the trapped light scatters out and was captured by the camera.
Figure 3: Conceptual Diagram of Tactile Imaging System (Saleheen et al., 2014)
The TIS G1 incorporates three units: a probe unit with optical waveguide and lighting source, a high resolution camera unit to capture the image, and a computer unit to analyze data (Lee and Won 2011). According to the description in (Saleheen et al., 2014), this design used PDMS as the transparent waveguide and it is flexible and has higher reflective index than the air. The dimension of the waveguide is 23mm × 20mm. The camera in TIS G1 is a mono cooled charged-coupled-device (CCD) camera F044B-NIR from Guppy Allied Vision Technology, which has 0.4 mega pixels maximum resolution with 8.4 μm × 9.8 μm individual pixel size and a pixel array of 768 × 492. It used four 1500 mill candela (MCD) ultra-bright white light emitting diodes (LED) as the light source, and each LED has 25 degree view angle. The LEDs are placed in the middle of each side with the nickel spacers. An interface to force gauge is placed on the top of the camera because in the experiment, a force gauge (Mark-10, NY, USA) need to be connected to obtain the force information. The force gauge can measure the force from the range of 0 to 50 N with the resolution of 0.05 N and will be screwed on the loading machine. The force information and integrated pixel value were record as output data. A firewire (IEEE 1394A) was used to connect the camera and computer. A round glass plate is placed under the lens to hold the frame and waveguide. Figure 4 shows the schematic diagram and the general layout of tactile imaging sensor.
Figure 4: The Schematic Diagram and General Layout of Tactile Imaging Sensor (Saleheen et al., 2014) (Lee and Won 2011)
Breast Imaging Application
To help physicians detect tumors more efficiently, various imaging techniques utilizing different modalities have been developed. The most popular methods are mammography (MG), magnetic resonance imaging (MRI), ultrasonic imaging (US) and Thermography.
Screening mammogram are x-ray exams of the breasts that are used for women who have no breast symptoms. The goal of a screening mammogram is to find breast cancer when it is too small to be felt by a woman or her doctor. In a mammogram, the breast is briefly compressed or squeezed between two plates attached to the mammogram machine- an adjustable plastic plate (on top) and a fixed x-ray plate to hold the x-ray film or the digital detector (on the bottom). However the compression can feel uncomfortable and even painful for some women and entire procedure for a mammogram takes about 20 minutes. Although mammography has been used from 1960s, it still comes with various disadvantages. Mammograms requires radiation, which could harm a growing fetus, in addition, repeated X-rays may cause cancer.
MRI scans can provide high resolution and cross section picture of the tissue using strong magnets and radio waves. It produces image to differential the soft tissues and hard tissues (Orel and Schnall, 2001). The energy of radio waves is absorbed by the proton and released after exciting molecules. The magnet coils in the machine receive the emitting energy and send the information to the computer. After computer process the information, a very detailed image of parts of the body is generated (Medical News Today, 2013). The breast cancer MRI is complicated. Before the scan, a contrasting dye liquid needs to be injected into a vein to suppress the fat and get better result. The cost of this test is expensive, and may take an hour. The cost of machine is very high and it needs a professional operator to operate and a radiologist to interpret. In addition, some types of medical implants are generally considered contraindications for MRI examinations. Patients are therefore always asked for complete information about all implants before entering the room for an MRI scan. According to my-ms.org, several deaths have been reported in patients with pacemakers who have undergone MRI scanning without appropriate precautions (My-MS.org. 2012).
Ultrasound, also known as sonography, is a non-invasive method to detect breast tumor which using sound waves to create an image of human tissue (Sehgal et al., 2006). During the test, a layer of gel is put on the skin of the breast and a handheld sensor instrument, then rubbed and pressed against the skin. The sensor emits sound waves to the breast tissues and receives the echoes. The echoes are transmitted to a computer to form a black and white image of the tissues. Ultrasound is less sensitive than MRI (that is, it detects fewer tumors), but it has the advantages of being less expensive and more widely available.
Thermography is another method to detect breast cancer. It uses a special heat sensing camera to measure and temperature on the surface of the breast. It is based on the idea that the blood flow and metabolism increased in the tumor area, and which will rises the temperature. However, this method is highly affected by the size of breast and the surrounding tissue. A 2012 research review found that thermography detected only a quarter of the breast cancers found by mammography (America Cancer Society, 2013).